1. Introduction
Vowels are a fundamental component of spoken language, and examining their properties and distributions can reveal commonalities and differences that enhance our understanding of human linguistic capacity. Studying vowels across languages is crucial in linguistics for several reasons. Understanding vowels helps linguists identify patterns and universals in phonological systems. Furthermore, vowels exhibit a wide range of phonetic diversity, and studying this diversity helps linguists understand the range of possible vowel sounds. Vowel studies enable linguists to make cross-linguistic comparisons that highlight unique and shared features among languages, revealing much about the nature of linguistic variation and common constraints on phonological systems.
Several studies have delved into the vowel systems of world languages (Greenberg, 1975; Ladefoged, 2001; Ladefoged & Maddieson, 1996; Maddieson, 1984; Moran, 2012; Schwartz et al., 1997). Greenberg (1975) provided a comprehensive overview of language universals and typology, noting a shift in American linguistics from emphasizing the differences of individual languages to focusing on common features and underlying principles. He discussed various types of language universals, including implicational universals, where the presence of one property implies the presence of another. For instance, Greenberg described Troubetzkoy’s typology of vowel systems: Rectangular Systems (equal numbers of front and back vowels), Triangular Systems (neutralization of front-back distinction in low vowels), and Linear Systems (no phonemic opposition between front and back vowels). Greenberg extended this typology by noting the absence of a theoretically possible pyramidal type, leading him to suggest an implicational universal: a front-back distinction in low vowels implies its presence in non-low vowels.
Maddieson (1984) provided a comprehensive analysis of sound patterns across a wide range of languages, offering crucial insights into vowel typology and phonological universals based on a survey of phonetic inventories from 317 languages in the University of California, Los Angeles (UCLA) Phonological Segment Inventory Database (upsid). He identified common patterns and constraints in vowel systems, elucidating the underlying principles governing vowel distribution and organization. Maddieson classified vowels by features such as height, backness, and rounding, analyzing their frequency and distribution. He found that certain vowel qualities, such as the basic set of five vowels /a, e, i, o, u/, were remarkably common across languages, suggesting a universal preference in phonological systems. One significant finding was the tendency for languages to favor symmetrical vowel systems, where front and back vowels are balanced. Maddieson also discussed less common vowel qualities, such as nasalization and length distinctions, providing a broader perspective on the diversity of vowel systems. His analysis showed that while there is considerable variation in vowel inventories, there are also striking regularities that point to universal tendencies in human language.
Ladefoged & Maddieson (1996) noted that vowels are produced without obstructing the vocal tract and form the primary component of a phonologically defined syllable. They referred to Lindau’s (1978) linguistic description of vowels in terms of height and backness. Examining American English vowels in both articulatory and acoustic terms, they found some discrepancies and suggested paying attention to both aspects of vowels. Their discussion on the vowels of world languages in the primary dimensions of height, backness, and rounding is particularly intriguing, especially regarding the levels of distinction in those dimensions. For example, they mentioned the five vowel heights in the Bavarian dialect in Austria reported by Traunmüller (1982). Although the International Phonetic Association (IPA, 2024) listed seven levels of vowel height, vowels of world languages generally showed three levels. Additionally, Ladefoged and Maddieson discussed exceptional cases, such as the rounded front vowels in Bavarian German and the unrounded high back vowel in Japanese. They provided robust evidence for both the diversity and universality of vowel systems, including nasalized and pharyngealized vowels.
Schwartz et al. (1997) classified the upsid inventory by grouping primary and secondary vowel systems; front, back, and low peripheral vowels for checking symmetry; holes at the top of the periphery; and non-peripheral vowels. They reported that primary vowel systems mainly contained 3 to 9 vowels and secondary systems 1 to 7 vowels, both with a preference for 5 vowels. In the two systems, vowels were mainly concentrated at the periphery, forming symmetry with the same number of front and back vowels. In asymmetrical systems, more front vowels were found than back vowels. Schwa was considered to exist due to intrinsic principles like vowel reduction and not to interact with other vowels.
Moran (2012) applied two statistical measures of association to the Phonetics Information Base and Lexicon (phoible) database. He obtained distance matrices by Pointwise Mutual Information (PMI) on all vowel data and plotted them through multidimensional scaling (MDS). PMI measures the mutual dependence of vowel segments. From the PMI of the 18 most frequent vowels, he noted that /a, i, u/ were the most likely vowels in a language. He also made an MDS plot from the PMI distance matrix and observed a separation between nasalized vowels and all other vowels on the x-axis, and diphthongs and all other vowels on the y-axis. MDS shows inherent patterns in the vowel space of inventories in the phoible database. Moran summarized his findings by noting that the smallest vowel systems tended to start with /a, i, u/ and seemed to grow by secondary vowel quality distinctions like nasalization, lengthening, and diphthongization. His analytic plots appear crowded because he analyzed all vowel data and did not further subset the vowels based on frequency size or the presence of diacritics, leaving this for future research.
Despite the importance of vowel systems in linguistic studies, there are still relatively few studies on the topic. This study seeks to fill the research gap by exploring the vowel systems of world languages using the phoible database. The primary objectives of this research include: (1) examining the distributions of vowels in world languages, and (2) analyzing the association of vowel segments statistically. The findings will offer valuable insights into the relationships and patterns among vowel inventories across different languages.
2. Method
Phoible is an extensive phonological database that consolidates phonetic and phonological data from a diverse array of global languages, sourced from various references (Moran & McCloy, 2019). The 2019 edition includes 3,020 inventories, 3,183 segment types, and 2,186 languages. Each language’s inventory details its vowels and consonants. The database is accessible without charge in multiple formats, facilitating the extraction and analysis of data to explore patterns and relationships among phonological systems across different languages.
The vowel inventories of the world’s languages in the phoible database were downloaded, and saved as a source file using the following R script (v.4.4.1, R Core Team, 2024):
url_ <- “https://github.com/phoible/dev/blob/master/data/phoible.csv?raw=true”
col_types <- cols(InventoryID=‘i’, Marginal=‘l’, .default=‘c’)
phoible <- read_csv(url(url_), col_types=col_types)
write_csv(phoibledata, “phoibledata.txt”)
The original database lists 105,484 phonemes based on ten sources: ph, spa, upsid, and others. Among them the ph source contains phonemes from 913 languages collected from journal articles, theses, and published grammars (Moran, 2012; Moran & McCloy, 2019). In contrast, the upsid source includes phonemes from 451 languages (Maddieson, 1984; Maddieson & Precoda, 1990). The spa source provides descriptions of phonemes, allophones, and phonological contexts for 197 languages (Crothers et al., 1979). To avoid overlapping phonemes when combining the ten sources, the author decided to choose one source by examining the description of the Korean vowel inventory. The ph source lists 28 vowels: /a, aː, e, eː, i, ia, ie, io, iu, iɛ, iʌ, iː, o, oː, u, ua, ue, ui, uɛ, uʌ, uː, əː, ɛ, ɛː, ɯ, ɯi, ɯː, ʌ/. The upsid source lists 11 vowels: /a, e, i, o, u, y, æ, ø, ɤ̞, ɯ, ɯi/. The spa source includes 18 vowels, which overlap with some vowel phonemes from the other two sources, but it covers the fewest languages of the three. The three symbols /y, ø/ in the upsid source might be controversial because they were produced as monophthongs in Standard Korean but presently more as diphthongs, /ui, ue/. In addition, the diphthong /ɯi/ tend to be produced as a monophthong /e/ in spoken Korean. If we collapse all the phonemes from the three sources together, any statistical analysis on them may be inflated with repeated phonemes within each language category. This study attempts to examine qualitative observations of unique vowels within each language category on the two primary dimensions of vowel height and backness, including diphthongs. Therefore, the author filtered 10,522 vowel phonemes from the ph source without tonal segment class, including glyphid (four-digit phoneme and diacritic code) and language names. The author manually inspected the ph source using Microsoft Excel by sorting the phoneme list by language category and identified 236 phonemes that were duplicated within a given language. Specifically, in Italian, 6 vowels were listed twice, indicating 12 unique vowels in the list. Similarly, in Nuer, 20 vowels were duplicated in its vowel inventories. The final dataset comprised 10,286 vowel phonemes. Further analysis on the other databases is desirable.
The glyphid was included to categorize the vowels into primary or secondary articulations by mutating the mixed representations of such secondary articulations as lengthened or nasalized vowels, parsing groups of four-digit modifier codes. The data were divided into two groups: vowels with or without diacritics; and three groups by the number of syllables. Schwartz et al. (1997) grouped primary and secondary vowel systems by the absence or presence of diacritics.
Two main statistical measures of association and tabulation function in R were applied to the ph vowel inventories of the world languages: PMI and MDS. First, the author determined distance matrices by PMI on the vowel inventories from the ph source. The procedures were as follows: tabulation of phonemes by language name, computation of cross products, and creation of a symmetric PMI matrix. Second, the PMI distance matrix was input into the cmdscale function in R to create MDS plots, inspecting inherent patterns in the vowel space of inventories in two major dimensions. The plots reflected the frequency information of each phoneme by size through normalizing frequency for better visual scaling and additional information.
3. Results and Discussion
The total number of phonemes in the ph source is 10,286. This source consists of 553 distinct vowel phoneme types. Among these, 166 types do not have any diacritics, while 387 types have one or more diacritics. The total number of vowel phonemes without diacritics is 6,586, whereas those with diacritics account for 3,700. Thus, distinct vowel phonemes without diacritics represent 30% of all distinct vowel phonemes but constitute 64% of the total number of vowel phonemes, indicating that primary articulations are more prevalent than secondary articulations.
Regarding syllable types, there are 252 distinct monophthongs, 280 distinct diphthongs, and 21 distinct triphthongs. The total number of monophthongs is 9,506; that of diphthongs is 757; and that of triphthongs is 23. Hence, monophthongs constitute 92.4% of the total number of vowel phonemes.
Table 1 lists the vowel phonemes from the ph source, ranked up to the 20th position by frequency.
The table reveals that the vowel /i/ appears in the inventories of 860 out of 913 languages in the ph source, representing 94.2%. The second most frequent vowel, /u/, occurs in 833 languages, a difference of 27 languages from the first rank. The third most frequent vowel is /a/, followed by /o/, /e/, /ɛ/, and /ɔ/. Moran (2012) reported that the three most frequent vowels are /a/, /i/, and /u/ based on the analysis of all vowels in the phoible database, whereas the current study relied on the ph source after removing duplicate phonemes. Figure 1 shows the vowel frequency distribution using normalized circle sizes on the IPA chart of 28 vowels.
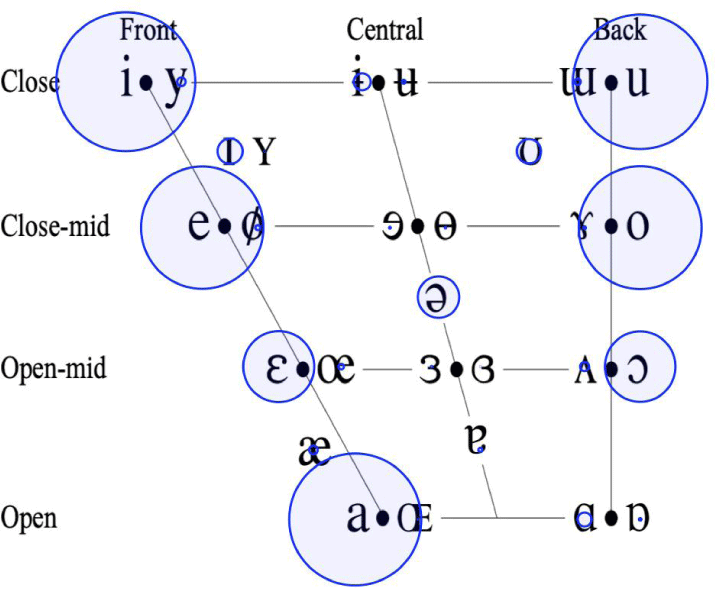
As shown in Figure 1, the circles for seven peripheral vowels /i, e, ɛ, a, u, o, ɔ/ are the most prominent. Among them, the vowels /ɛ/ and /ɔ/ are relatively less prominent, followed by the schwa /ə/ and the lax vowels /ɪ/ and /ʊ/. Among the vowels with smaller circles, /ɨ/ appeared in 105 languages, and /ɑ/ occurred in 86 languages. The vowels /ʌ/, /æ/, and /y/ were recorded in the inventories of 55, 53, and 53 languages, respectively. The remaining vowels appeared in fewer than 30 languages, with only two languages including the vowel /ɞ/ and no language adopting the vowel /ɶ/ in the ph source. Maddieson (1984) noted that languages tend to favor symmetrical vowel systems, forming balanced front and back vowels. This figure generally supports the notion in the vowel backness dimension on the height dimension, i.e., Close to Open-Mid levels, except Open level with the low vowel /a/, which indicates an exceptionally larger size in the front peripheral column than that of the low vowel /ɑ/ in the back peripheral column. The two vowels, /ɛ/ and /ɔ/ in the Open-Mid level are smaller in frequency size among them but the size looks quite comparable in the backness dimension. All these vowels are located in the peripheral areas while the frequency distribution of the central vowels appears relatively smaller. Here one may argue that the low vowel /a/ should be placed at the center of the low backness dimension. Yang (1996) measured vowel formant frequency values at the 1/3 comparable timepoints proportional to the total duration of given vowels to find that the Korean vowel /a/ is located acoustically at the center of the low backness dimension of a triangular shape. On the other hand, in English he concluded that two low vowels /a, æ/ pushed them apart to place the vowel /a/ at the low front and the vowel /æ/ at the low back to secure sufficient perceptual contrast, thus forming a rectangular shape. If that is the case, the symmetry proposal might prove to be true for the Korean vowel system but not for the English vowel system. An appropriate representation of the IPA vowel shape reflecting the acoustical vowel measurements of world languages may provide a solution on this issue.
Next, the author examines secondary articulations, which involve one or more diacritic symbols. As seen in Table 1, the eighth-ranked phoneme includes a diacritic indicating lengthening by the diacritic symbol (ː), which is attached to the major seven vowels in the higher ranks. Lengthening is prevalent among secondary articulations, with 2,346 occurrences, followed by 1,101 nasalized vowels in the 913 world languages. The three most frequent nasalized vowels are also in the order of /i/, /a/, and /u/. Breathy voiced vowels number 179, non-syllabic vowels 150, and creaky voiced vowels 69. Those results suggest that lengthening and nasalization are major secondary articulations in the ph source but the frequency size varies.
Recalculating vowel frequency distribution focusing on representative qualities by removing diacritics such as lengthening and nasalization would likely alter the distribution. However, this approach may also inflate the analysis result due to the same two vowels, i.e., duplicates, in a language.
Figure 2 presents a multidimensional scaling plot based on pointwise mutual information for all the vowels in the ph source.
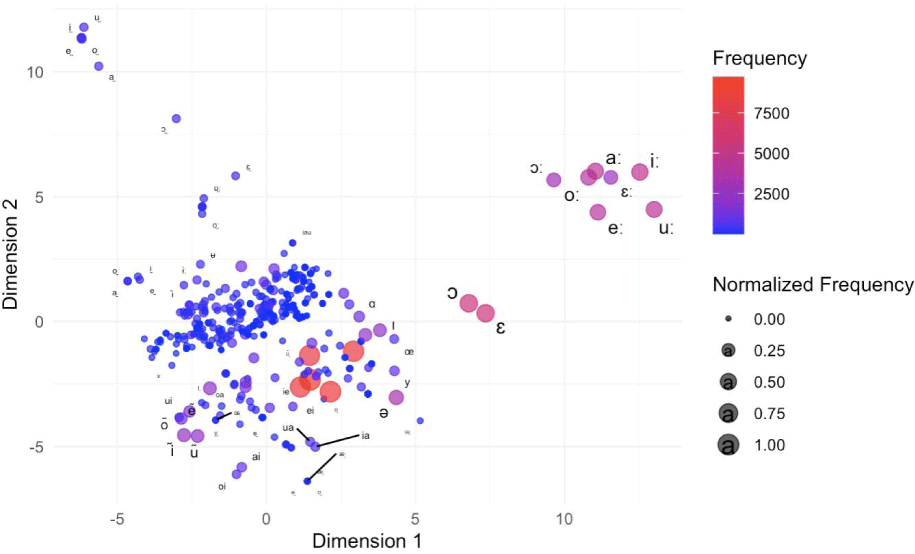
The figure clearly groups the vowels, with primary articulated vowels near the origin represented by larger circles. Nasalized vowels are spread around the primary vowels, mostly on the lower left side. The lengthened vowels are positioned in the upper right corner, while breathy voiced vowels are found in the upper left corner. Several diphthongs appear in the lower left section. Thus, the MDS plot effectively groups vowels to form distinct clusters. However, the plot is crowded, making it difficult to discern groups due to many overlapping, unlabeled vowel symbols. To improve clarity, we divide and plot the vowels into those with or without diacritics in the following sections.
Figure 3 displays an MDS plot based on PMI for the vowels without diacritics in the ph source. The plot shows the seven most frequent vowels in the center-right area. The lax vowels /ɪ/, /ʊ/, and /æ/ are positioned diagonally down to the low vowel /ɑ/, mirroring the seven most frequent vowels on the origin. These vowels are slightly away from the horizontal line or Dimension 1. Again, some labels are missing due to overlapped points, including the sixth most frequent vowel /ɛ/. The close central unrounded vowel /ɨ/ is near the origin of the two major dimensions. Diphthongs are scattered widely around the origin, with some positioned far from the origin in smaller circles, indicating lower occurrences. These diphthongs might have influenced the location of the major vowels. We will create an additional MDS plot later through removing all diphthongs to provide a simpler view.
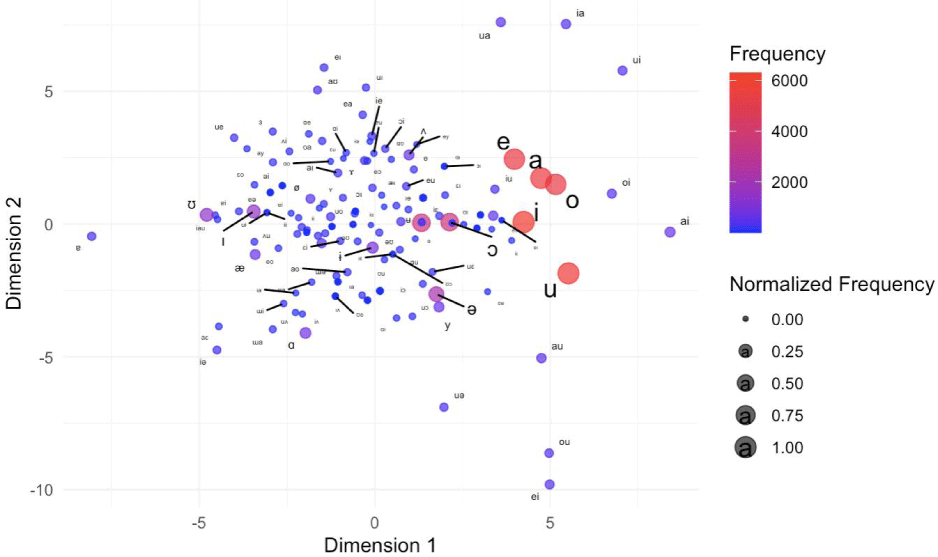
Figure 4 presents an MDS plot based on PMI for the vowels with diacritics in the ph source.
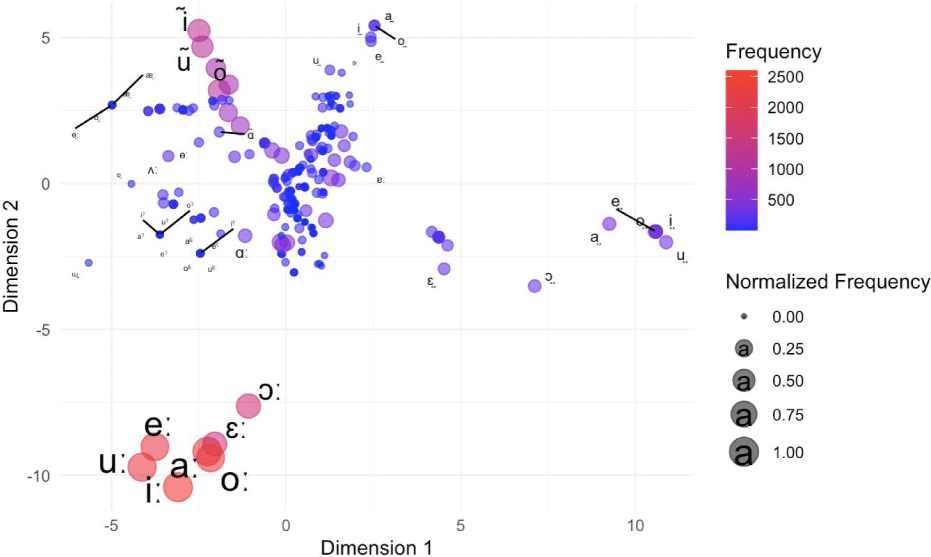
The figure provides an overview of vowel frequency and distinct groupings based on diacritics. Vowels with a lengthening diacritic are positioned in the lower-left corner, while nasalized vowels, the second most frequent vowel group, are in the upper-left corner. Breathy vowels are placed in the right-center of the figure. Those groupings would have been missed in Figure 2. Here several diphthongs might have influenced the mapping of the major vowels with diacritics.
Figure 5 shows an MDS plot based on PMI for the ten most frequent vowels (/a, e, ə, ɛ, i, ɪ, o, ɔ, u, ʊ/) without diacritics in the ph source. These vowels account for 5,464 occurrences in 150 or more languages, as shown in Table 1.
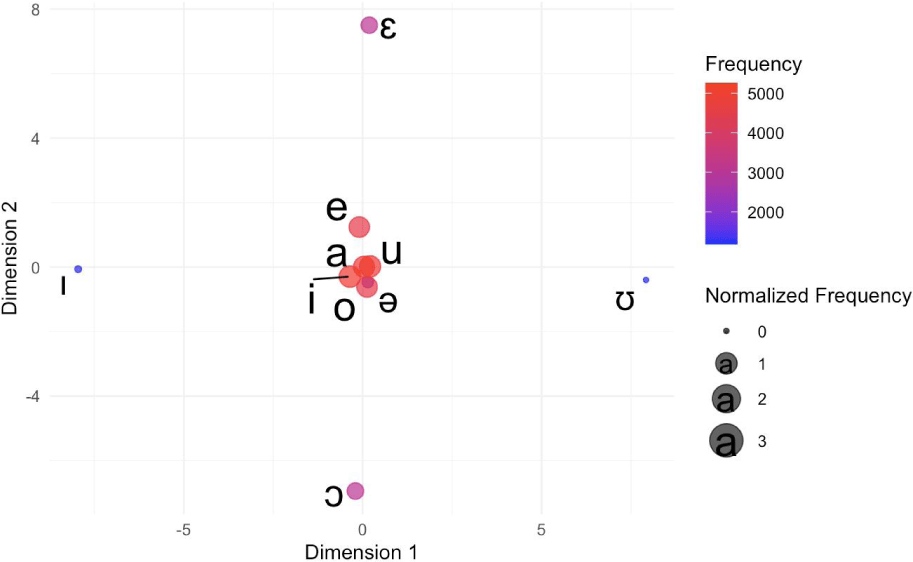
The figure provides a detailed view of the ten most frequent vowels. The six most frequent vowels are near the origin, with the other four peripheral vowels scattered around it. Notably, the vowel /a/ is almost at the origin, while the four peripheral vowels (/ɛ, ɪ, ɔ, ʊ/) are spread out, forming pairs (/e-ɛ, i-ɪ, o-ɔ, u-ʊ/) closer to each other. The schwa vowel /ə/ is positioned between the peripheral vowels /ɔ/ and /ʊ/, indicating a qualitative association with them.
Here we plot the phoneme association network on the ten most frequent vowels in Figure 6.
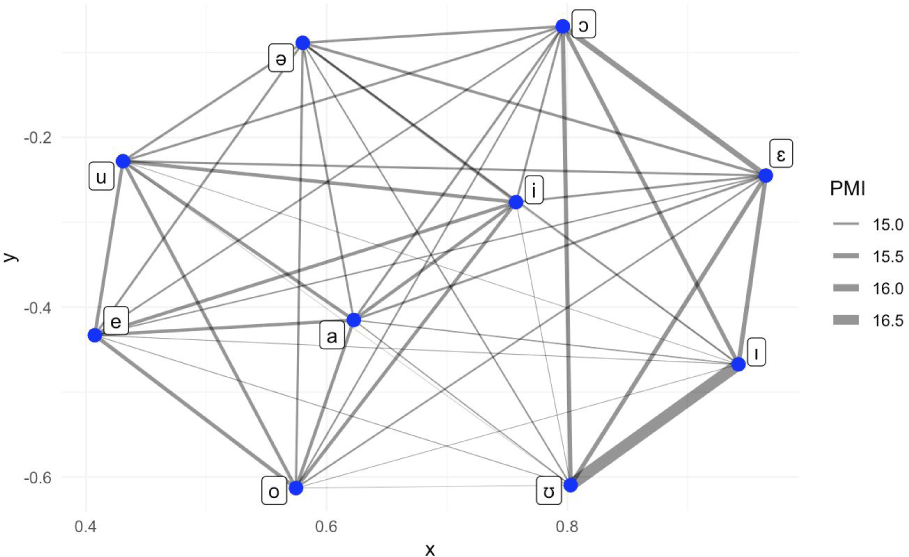
The figure displays the association strength of co-occurrence, represented by the width of the links between node points. The vowels /ɪ/ and /ʊ/ show the strongest association (16.5), indicating they co-occur most frequently in the ph source. The second-strongest association is between the vowels, /ɛ/ and /ɔ/ (16.0). Additionally, the vowels, /a/ and /i/ are central in the association network, while the vowel /u/ is in the upper-left corner. These three vowels are the most frequently occurring ones, as shown in Table 1. The plot could be used to test a hypothesis suggesting that the presence of a specific vowel phoneme in a language may imply the presence of another vowel phoneme in the same language. On the other hand, if there are too many vowels, it may appear too crowded to distinguish the strength of associations among specific vowel pairs. For example, a base PMI plot for all the vowels of Figure 2 would make it difficult to identify the pairwise strength of associations. Further studies should subset vowel inventories and conduct detailed analyses between primary and secondary vowels, as well as between primary vowels and diphthongs.
Lastly, we need to discuss the results of this study and address its limitations. As Moran (2012) pointed out, the representation of vowels might be influenced by different criteria used by linguists in creating appropriate phonetic symbols for each language. For example, Korean phoneme inventories are listed with or without diphthongs, and the diacritic for lengthening is not used in the upsid source. The association plot might vary depending on whether vowels with or without diacritics are included. Additionally, the abstract phonemic representation should undergo rigorous screening using acoustic and perceptual guidelines. Normalized articulatory or acoustic vowel information of world languages could provide explanatory insights into vowel systems as was discussed on Figure 1. Moreover, Yang (2012) suggested to consider a real speech corpus in discussing phonetic universals or markedness evaluation. He examined vowel and consonant production in American English using data from the Buckeye Speech Corpus, which included recordings from 40 American speakers. The study analyzed phonemic and phonetic transcriptions to obtain the frequencies of vowel and consonant sounds. One key finding was that American English speakers reduced the number of vowels and consonants in daily conversation compared to dictionary transcriptions, with a reduction rate of approximately 38.2%. This significant deviation highlights the dynamic nature of spoken English. The study also found that American English speakers used more front high vowels (e.g., /i/ and /ɪ/) and back low vowels (e.g., /ɑ/ and /ɔ/) in daily conversations. These findings underscore the importance of considering actual speech data in linguistic studies. In that sense incorporating phoneme information along with the actual frequency distribution of world languages would be desirable.
4. Summary and Conclusion
This study investigated the phoible database, an extensive phonological dataset encompassing phonetic and phonological data from numerous global languages, to explore vowel systems. Through MDS based on PMI, this research examined the frequency distribution and association patterns of vowel phonemes, both with or without diacritics. The results indicated that primary articulations prevailed over secondary articulations, with monophthongs constituting the majority. The study identified distinct groupings of vowels, such as nasalized and lengthened vowels, and highlighted the co-occurrence patterns of the most frequent vowels. This research contributed to the understanding of vowel distribution and relationships, revealing distinct patterns in phonological systems. Future studies should explore detailed analyses between primary and secondary vowels and consider the establishment of linguistic criteria on vowel representation.


