1. Introduction
Speech sound disorders (SSDs) in children refer to a range of difficulties children experience when producing speech sounds (McLeod & Baker, 2017). They often pose a serious impairment to a child’s ability to articulate their thoughts during spoken communication. A child with SSDs might face social and educational barriers that have a lifelong impact on the child’s life (Hitchcock et al., 2015; Sices et al., 2007).
Detecting and treating SSDs is difficult as the disorders often vary in severity, cause, type, and individual response to intervention, requiring tailored assessment and treatment approaches (Shahin et al., 2020). The limited accessibility of speech-language pathologists and the high costs associated with in-person treatment highlight the need for a more affordable and accessible method of detecting SSDs.
The rapid advancement of machine learning technology during the past decade has enabled the use of neural network models in the automatic detection of SSDs. For example, Kothalkar et al. (2018) and Laaridh et al. (2017) have utilized I-vectors, a representation used for speaker verification and language identification for SSD detection. Wang et al. (2019) used Siamese neural networks for discriminating correct phonemes from incorrect phonemes and use the result for diagnosing SSDs. Ng et al. (2023) used paralinguistic features such as duration and formants in training neural network models for classifying speakers with SSDs. To address the issue of limited availability and improve model performance, data augmentation methods are often used where new speech samples are generated using samples from the original train set (Geng et al., 2020; Jiao et al., 2018; Sudro et al., 2021).
Transformer-based models pre-trained on large speech datasets have shown remarkable performance on many tasks such as automatic speech recognition (ASR) and audio classification. For example, wav2vec2 (Baevski et al., 2020) is trained on a large amount of unlabeled speech data, so that the model can understand and represent raw audio waveforms as dense vector representations. Thanks to the pre-training, wav2vec2 can perform many speech-related downstream tasks by fine-tuning the model with a small amount of data (Getman et al., 2022; Javanmardi et al., 2023). Whisper (Radford et al., 2023) is another transformer-based model used for speech recognition. Unlike wav2vec2, Whisper is trained on a large amount of labeled data, comprising multiple languages. Therefore, Whisper is able to generate transcriptions from audio data without further fine-tuning. Also, since Whisper can extract audio features that can represent the speech contained in the audio, we can use Whisper to create an audio classification model by fine-tuning labeled datasets.
In this paper, we study the effectiveness of building automatic detection systems using the Whisper model. Since Whisper can be used for ASR and audio classification, we present various methods we can utilize Whisper for SSD detection. Specifically, we study ASR-based SSD detection and AC-based SSD detection. For the ASR-based methods, we describe various schemes for establishing SSD thresholds. For the AC-based methods, we present word-based and speaker-based audio classification for SSD detection. The presented methods were evaluated using the Korean children SSD dataset collected for this study.
The summary of findings is as follows. For the ASR-based methods, the low accuracy of ASR models compared to humans can hinder the reliability of SSD detection. Many utterances where human transcriptions matched the target word were incorrectly transcribed by the ASR model, resulting in misidentifying a normal child as SSD. Therefore, adjusting the SSD thresholds considering the performance of the ASR models was an effective strategy for improving SSD detection accuracy. However, it is also important to enhance the ASR performance in order to improve the interpretability of models; the system should produce reports showing how the child pronounced each target word.
For the AC-based models, the prediction is biased in the direction in which SSD is misclassified as normal. One of the reasons is the fact that there are more normal speech samples than SSD speech samples, resulting in an imbalanced dataset. Data augmentation techniques may help reduce the bias. Comparing the word-based and speaker-based audio classification, we showed that identifying the correctness of eachword uttered by the subject and determining SSD based on the ratio of correct words leads to better performance.
2. The Korean Children Speech Sound Disorder (SSD) Dataset
The data collection process in this study adhered to ethical guidelines and was approved by the Institutional Review Board (IRB) of (disclosed after acceptance), under approval number (disclosed after acceptance). Informed consent was obtained from the parents or legal guardians of all participating children, and all procedures were conducted in accordance with the ethical standards set forth for research involving children.
We collected a 4.6-hour dataset of child speech from 573 participants aged 2 to 9. The participants were asked to pronounce the target words from the Assessment of Phonology and Articulation for Children (Kim et al., 2007), a standardized test for Korean-speaking children. There are 37 target words ranging from 1 to 4 syllables. Table 1 shows examples of the target words.
For each child, an audio recording was generated for the whole duration of a session where the instructor interacted with the participating child to go through the list of target words. After obtaining the audio recordings, the recordings were chunked into recordings of each target word pronunciation and transcribed using Praat (Boersma & Weenink, 2001). During the process, some utterances were removed because the speech was unrecognizable or significantly overlapped with other voices such as those of the instructor. If a child spoke the same target word multiple times, those utterances were saved independently.
We saved the word-level audio files containing the target words along with their transcriptions and metadata in our database. A total of 21,915 samples were collected, which corresponds to 38.2 utterances per participant on average. Each audio sample has an average duration of 0.75 seconds. The metadata includes the speaker ID, age, target word, transcription, and the path of the audio file.
The participants were identified as typically developing (TD) or speech sound disorder (SSD) based on their age and pronunciation accuracy. First, each audio sample was labeled as Match or Mismatch, depending on whether the human transcription matched the target word or not. Then, percent whole-word correct (PWC) was calculated for each participant as the ratio of matched words over total spoken words.
Note that percent consonants correct (PCC) is another metric often used for determining pronunciation accuracy. Here we use PWC for simplicity.
The participants are divided into 12 age groups. Within each age group, each participant is classified as either TD or SSD based on their PWC. Assuming a normal distribution, a participant is identified as SSD if his or her PWC is below 1 standard deviation from the mean. Among all the participants within an age group, approximately 16% are labeled as SSD. Figure 1 shows the number of TD and SSD speakers in each age group. In the figure, the age group ‘3’ refers to children older than 3 years but younger than 3 years and 6 months. Also, the age group ‘3.5’ refers to children older than 3 years and 6 months but younger than 4 years.
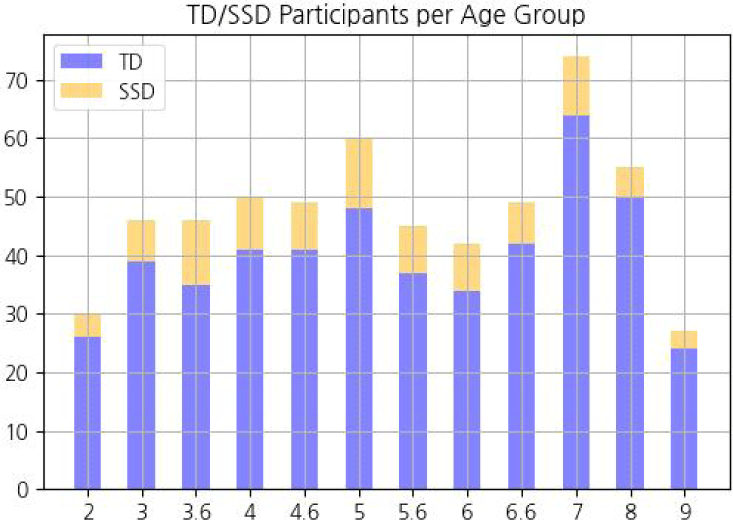
Table 2 shows an example of metadata stored in the database. The label and age are encoded as integers.
| Key | Value |
|---|---|
| Speaker ID | 326 |
| Label | 0 (typically developing) |
| Age | 4.5 (4 years 6 months–5 years) |
| Target word | 포도 |
| Transcription | 포도 |
| File path | data/speaker326/326_APAC_11.wav |
3. Speech Sound Disorder (SSD) Detection Methods
To implement an automatic SSD detection system that does not require human intervention, we need to be able to calculate the PWC of a child without having speech pathologists transcribe and analyze the recordings. We can achieve this by using ASR or audio classification techniques based on neural networks. Here we describe various methods based on ASR and audio classification (AC) and study their performances in the evaluation section.
Regardless of the method, we need to have a training set from which we train neural networks or calculate thresholds and a test set used for performance evaluation. In this study, we use five-fold cross-validation, where we divide the whole dataset into five subsets. In each run, four of the subsets become the train set and the other subset becomes the test set. A total of five runs are executed, having each subset as the test set. Finally, the results are averaged over the five runs. When dividing the dataset, we made sure the audio samples from the same speaker do not go into multiple subsets, because having the same speaker in the train and test set could create the “speaker bias”. Also, the number of participants from each label and age group was evenly distributed across the subsets.
The most direct method for automatic SSD detection is to replace human transcription with ASR transcription. Since PWC can be systematically calculated from transcriptions, we can fully automate the SSD detection process. Recently, end-to-end ASR models based on pre-trained neural networks such as Whisper (Radford et al., 2023) have shown good zero-shot accuracy in transcribing audio files without further fine-tuning.
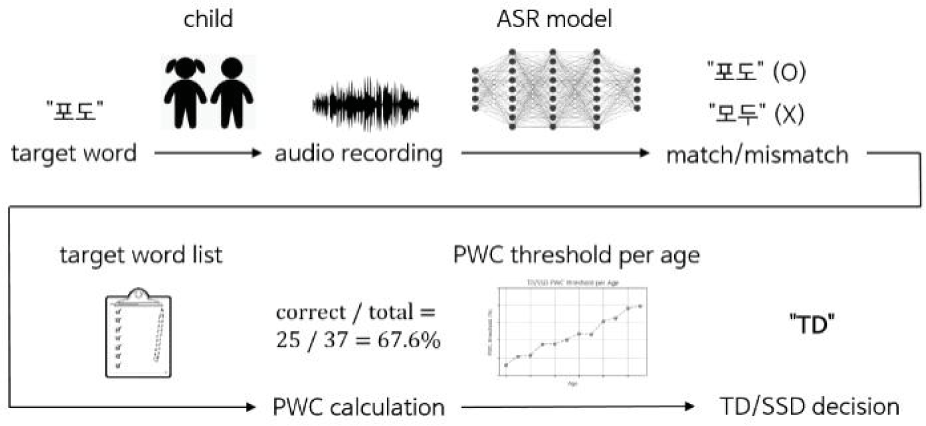
Figure 2 shows the procedure for SSD detection using ASR. The ASR model transcribes the recordings of a child for the target words. Then, the PWC of a child is calculated based on how many words the ASR correctly transcribed. If the PWC is higher than the TD/SSD threshold for the child’s age, the child is classified as TD. Otherwise, the child is classified as SSD.
The challenge of using ASR is that ASR models cannot accurately recognize children’s speech due to their non-fluent pronunciation and the variability in their speech patterns. As a result of the low accuracy of ASR, children’s PWC may be underestimated, which can result in normal children being classified as having SSD. Therefore it is necessary to carefully control the TD/SSD threshold considering the accuracy of ASR in the decision phase. Here we present three different methods.
The first method is to use the threshold acquired from human transcriptions. From the train set, we establish the TD/SSD boundary for each age group. Specifically, the SSD threshold for a particular age group is the average of the minimum PWC among TD speakers and the maximum PWC among SSD speakers. Table 3 shows the SSD threshold based on human transcriptions, averaged over the train sets.
| Age | 2 | 3 | 3.5 | 4 | 4.5 | 5 |
| Thresh. (%) | 11.7 | 21.6 | 22.7 | 35.6 | 35.8 | 40.8 |
| Age | 5.5 | 6 | 6.5 | 7 | 8 | 9 |
| Thresh. (%) | 47.4 | 46.8 | 61.8 | 65.5 | 76.4 | 79.0 |
The second method is to estimate the SSD threshold from ASR transcriptions. For each age group in the train set, we use Whisper to automatically transcribe the audio samples. Then, we calculate the PWC of each speaker based on the ASR transcriptions. Due to the low accuracy of ASR, the PWC calculated from ASR transcriptions is significantly lower than the PWC calculated from human transcriptions.
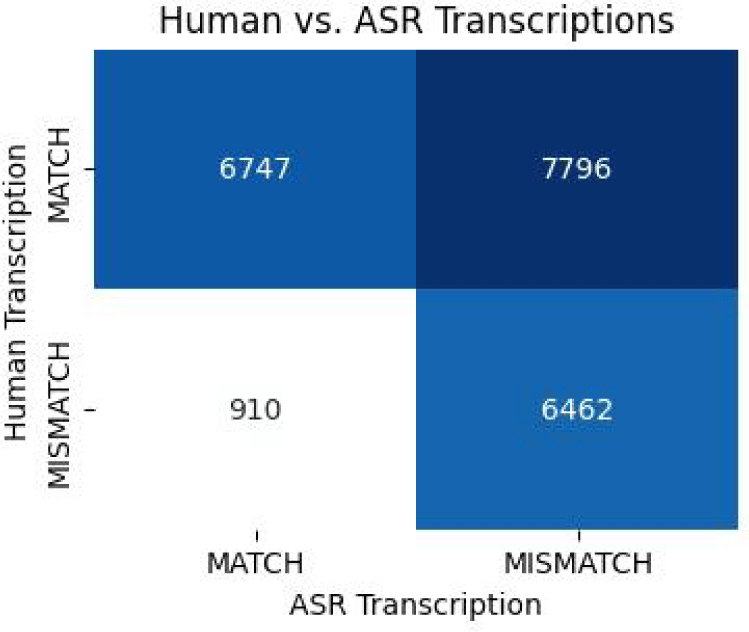
Figure 3 shows a confusion matrix for human and ASR transcriptions on the whole dataset of 21,915 audio samples. The human transcription of 14,543 audio samples (66.4%) matched the corresponding target word, indicating that the child correctly pronounced the word. However, ASR incorrectly transcribed 7,796 out of 14,543 audio samples, which led to significantly lower PWC. Among 7,372 audio samples (33.6%) for which the human transcriptions did not match the target words, ASR produced mismatched transcriptions for 6,462 samples and generated matched transcriptions for 910 samples.
To consider the performance of ASR in producing accurate transcriptions, we need to adjust the SSD threshold accordingly. Therefore, after calculating the PWC of all speakers in a particular age group using ASR, we set the SSD threshold as the mean of PWC minus 1 standard deviation, assuming a normal distribution. Table 4 shows the SSD threshold based on ASR transcriptions, averaged over the train sets. We can observe that the threshold is much lower than those established from human transcriptions.
| Age | 2 | 3 | 3.5 | 4 | 4.5 | 5 |
| Thresh. (%) | –0.7 | 4.6 | 4.0 | 10.2 | 10.9 | 17.0 |
| Age | 5.5 | 6 | 6.5 | 7 | 8 | 9 |
| Thresh. (%) | 21.4 | 21.3 | 29.7 | 34.0 | 41.7 | 42.0 |
The problem with the second method is that the original labels of TD and SSD assigned to the speakers are not used in calculating the SSD thresholds. Regardless of TD and SSD, the PWC of participants in an age group is recalculated using ASR transcriptions. Because of that, sometimes the ASR PWC of a TD child is lower than the ASR PWC of an SSD child.
In the third method, after calculating the PWC of TD and SSD participants in an age group, we estimate the probability density functions of the two groups using Gaussian Kernel density estimation (KDE). Then, we find the intersection of the density functions and use the intersection as the boundary for dividing TD and SSD. This strategy considers the originally assigned labels when estimating the threshold. Table 5 shows the SSD threshold based on Gaussian KDE. We can observe that the thresholds are higher than the values obtained from the second method.
| Age | 2 | 3 | 3.5 | 4 | 4.5 | 5 |
| Thresh. (%) | 3.5 | 8.8 | 13.1 | 19.4 | 19.5 | 27.4 |
| Age | 5.5 | 6 | 6.5 | 7 | 8 | 9 |
| Thresh. (%) | 28.7 | 33.7 | 37.9 | 44.2 | 33.7 | 40.1 |
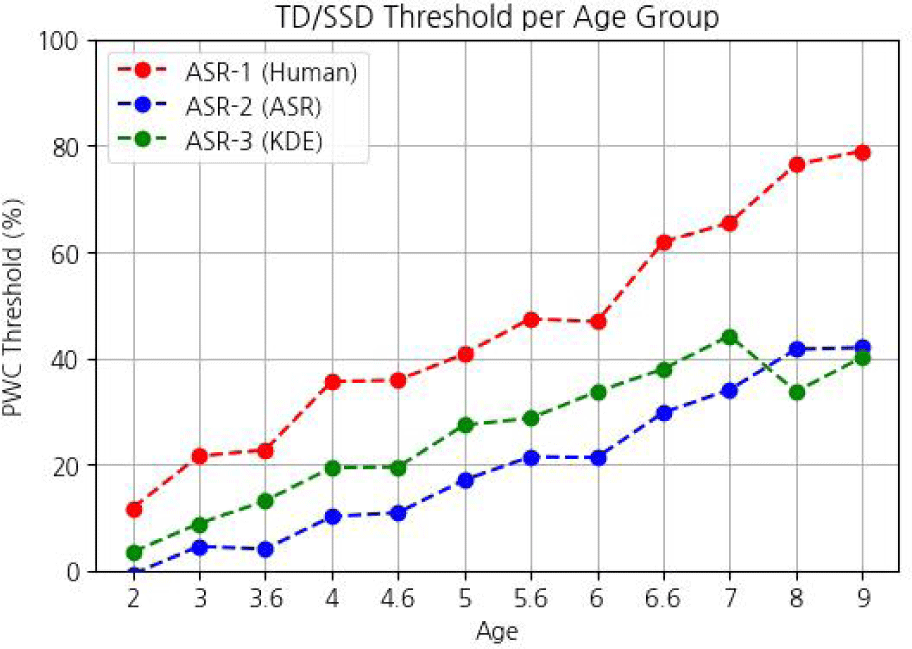
Figure 4 shows the SSD threshold for all three ASR-based methods. The thresholds established by the human transcriptions are at the highest, followed by thresholds estimated from Gaussian KDE. Thresholds calculated by the ASR transcriptions have the lowest values.
To achieve the goal of detecting speakers with SSD, we do not need to explicitly transcribe the recordings. Instead, we can train an audio classifier model that takes the audio as an input and predicts which category the audio sample belongs to. The Whisper model can be utilized as an audio classifier by attaching a sequence classification head at the end of the encoder layers and fine-tuning it with labeled data. The classification head consists of a pooling layer for compressing the encoded vector embeddings, followed by a linear layer for final classification. Here we present two methods that use the audio classification method to detect SSD.
The first AC-based method is to train the Whisper audio classification model to classify TD and SSD speeches. Figure 5 shows the procedure of this method.

To follow this approach, we concatenate all audio samples from the same speaker to create a dataset of combined speech containing 573 samples. Each audio sample is labeled as TD or SSD based on the speaker labels. Similar to ASR-based methods, we use five-fold cross validation where we divide the dataset into five subsets choose one subset as the test set, and train the rest for each run. We fine-tune the Whisper audio classification model on the train set and evaluate the model performance on the test set. The final evaluation metrics are averaged over five runs, each with a different subset used as the test set.
The problem with the first method is that since we combine the audio samples of speakers, we are left with a small train set which may negatively affect the neural network training. An alternative method is to classify word-level audio samples instead of combined speech. For each audio sample, we assign its label as either “correct” or “incorrect”. If the human transcription for the word is the same as the target word, the audio sample is labeled as “correct”, meaning the audio sample contains the correctly pronounced utterance. If the human transcription does not match the target word, the sample is labeled as “incorrect”. The procedure for word-level audio classification is shown in Figure 6.
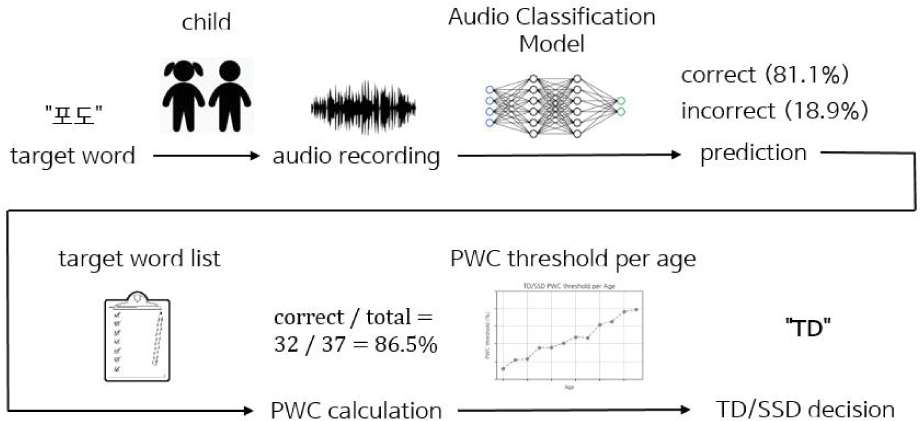
The Whisper audio classification model is trained with the train set to classify whether the audio sample is correctly pronounced or not. For evaluation, all of the audio samples of a speaker from the test set are fed into the audio classification model which predicts whether each of the audio contains the correct pronunciation of the target word. From the results, we can calculate the PWC of the speaker as follows.
Finally, the speaker is identified as TD or SSD based on the threshold calculated from human transcriptions (described in 3.1.1).
4. Performance Evaluation
We have evaluated the performance of five different methods for SSD detection using the five-fold cross validation as previously discussed. We have used three different metrics that are widely used for evaluating classification models: unweighted average recall (UAR), F1 score, and accuracy. The equation for calculating UAR is as follows.
In the equation, N refers to the number of classes, TPi to the number of true positives for class i, and FNi to the number of false negatives for class i. UAR is widely used when the classes are imbalanced in the test set, which is the case for our study. We regard UAR as the most important metric for measuring the model performance.
The F1 score is calculated using the following equations. It is another widely used metric for classification with imbalanced datasets.
The accuracy is calculated using the following equation. The disadvantage of this metric is that it can be misleading when the dataset is imbalanced. For example, in our dataset, 84% of the speakers are labeled TD whereas 16% of the speakers are labeled SSD. If a model predicts all speakers as TD, it will achieve 84% accuracy, which does not reflect the problem of the model.
For the ASR-based methods, we use the “whisper-large” model which has 1.5 billion parameters, pre-trained on 680 K hours of labeled speech data. There are tunable parameters that influence the transcript generation such as temperature, beam size, and best of. The temperature is a parameter that adjusts the flatness of the probability distribution when the model generates the next word. We use a low temperature of 0.1 so that the model concentrates on high-probability words. The beam size is the number of paths considered in the beam search algorithm. We use 5 for the beam size, which is moderately large and increases the likelihood of finding a more optimal output. The best parameter is used to select the best output from multiple attempts. We use 1 as the parameter for computational efficiency.
For the AC-based methods, we fine-tune the “distil-whisper/distil-medium.en” model for the audio classification task. The model is a distilled version of the Whisper model, which is smaller than “whisper-large” with 394 million parameters. Still, the ASR performance of distil-medium.en is comparable to that of whisper-large. For the AC-1 method that uses combined speeches, the model is trained for 10 epochs with a batch size of 8, a learning rate of 1e-5, and a weight decay of 0.005. For the AC-2 method that uses word-level audio classification, the model is trained for 3 epochs with other hyper-parameters set to the same values as the AC-1 method. The training was done using a single RTX4090 GPU on a Linux machine.
Table 6 shows the summary of results for the SSD detection methods. Among the ASR-based methods, estimating SSD thresholds based on kernel density estimation achieves the highest UAR at 73.5%. This is due to the fact that the method considers both the performance of the ASR model as well as the original TD/SSD labels.
| Method | UAR | F1 score | Accuracy | |
|---|---|---|---|---|
| ASR-based | ASR-1 | 62.3 | 37.3 | 37.5 |
| ASR-2 | 70.9 | 70.3 | 83.6 | |
| ASR-3 | 73.5 | 65.0 | 74.0 | |
| AC-based | AC-1 | 68.0 | 71.1 | 86.9 |
| AC-2 | 73.9 | 79.1 | 90.9 | |
Figure 7 shows the confusion matrix of the three ASR-based methods. The confusion matrix of ASR-1 shows that a large portion of TD speakers were misclassified as SSDs (74.1%). Since the PWC calculated from ASR transcriptions is significantly lower than the PWC calculated from human transcriptions, most speakers in ASR-1 cannot pass the SSD threshold in their age group and are thus classified as SSD. Therefore, UAR as well as F1, and accuracy are very low for this approach.

The confusion matrices of ASR-2 and ASR-3 show that the number of correctly classified TD is significantly higher than ASR-1, thanks to the adjustment of the SSD threshold as estimated from the train set. Comparing ASR-2 and ASR-3, The ASR-2 method tends to classify a speaker as TD with a high probability. This is because the SSD threshold of ASR-2 is very low and thus a lot of speakers show PWC above threshold and are classified as TD. Establishing the SSD threshold based on pure ASR-based PWC may result in low thresholds because for some speakers, the ASR model shows a very low audio transcription accuracy. While those speakers will be categorized as SSD in ASR-2, one may be TD and still have a very low PWC due to the ASR model performance. ASR-3 addresses these issues and sets the thresholds at higher values compared to ASR-2.
Among AC-based methods, AC-2, which classifies word-level audio samples and then calculates PWC to determine TD and SSD achieves the highest UAR as well as F1 and accuracy among all five methods. On the other hand, the performance of audio classification using combined speech is not so good, which may be due to the fact that the number of data samples is limited with combined speech leading to overfitting in the training. When overfitting occurs, the model classifies samples based on spurious features such as pitch and tone.
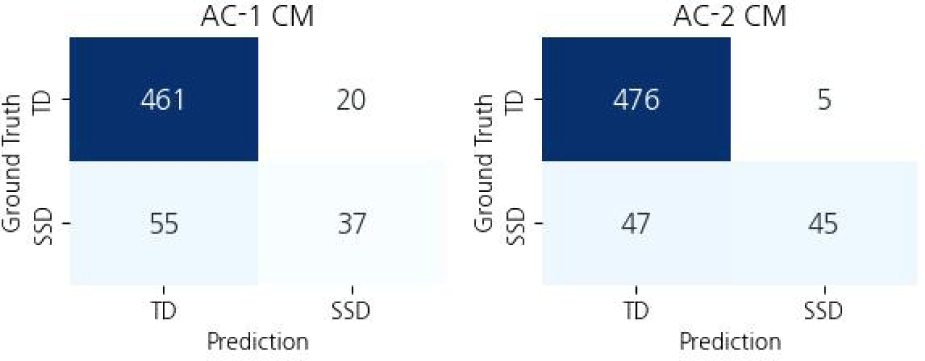
Figure 8 shows the confusion matrices of the AC-based methods. Compared with AC-2, the AC-1 method misclassifies more TD and SSD speakers, leading to a lower UAR and accuracy. While AC-2 performs the best among presented methods, about half of SSD speakers were misclassified as TD, suggesting that the model tends to classify audio samples as “correct”. One of the reasons for this behavior is because the classes are imbalanced: 66.3% of the samples are labeled as “correct” while 33.7% are labeled as “incorrect”.
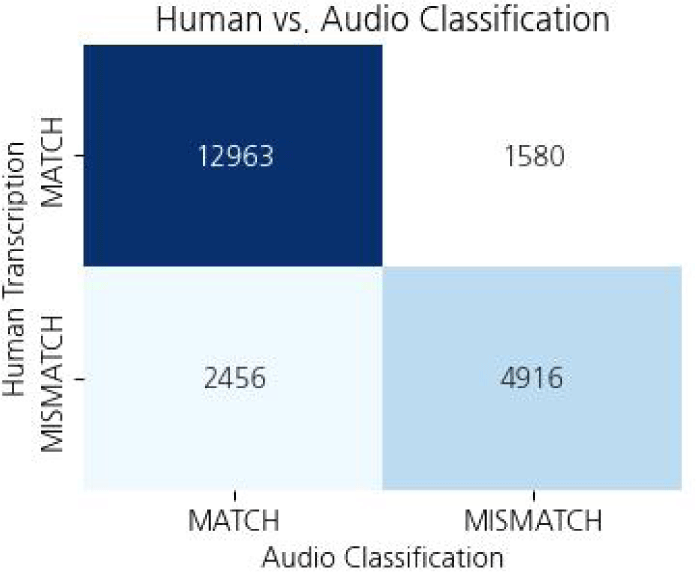
The reason AC-2 achieves the best result is due to the performance of audio classification models in classifying correctly pronounced words. Figure 9 shows the confusion matrix of the audio classification model. Compared with the transcription performance of ASR models shown in Figure 3, the accuracy of the audio classification model is much higher at 81.6% (compared to ASR accuracy of 60.2%). The audio classification model performs better as it was fine-tuned on the children’s speech data, while the ASR model was not fine-tuned.
The experiment results show that with the current state-of-the-art speech recognition models, we can achieve a little above 70% UAR in automatically detecting SSDs. However, this study has several limitations that can be improved by further research.
First, when labeling speakers, the SSD label was assigned when the PWC of the speaker is below 1 sigma in the same age group, assuming each age group forms a normal distribution. However, due to a small dataset, the distribution may not follow the normal distribution, which may lead to wrong labels. Although using 1 sigma as the boundary for TD/SSD assignment is a standard practice in the field (Han & Kim, 2021), it is crucial to collect a large amount of data so that the PWC of speakers in each age group follows the normal distribution and the labeling becomes more accurate.
Second, we used a zero-shot ASR model to automatically transcribe the speech samples before calculating the PWC. the ASR performance can be improved by fine-tuning the model on children’s speech data. Third, when training the audio classification model, there are several techniques that can be applied to improve audio classification performance. Various data augmentation techniques such as SpecAugment (Park et al., 2019) can be applied to improve classification accuracy. Also, since there is a class imbalance between TD and SSD data, we can apply techniques such as oversampling and re-weighting to mitigate its negative impact.
Finally, several methods can be applied to increase the generalizability of the model. The data collection was mostly done in kindergartens, daycare centers, and speech therapy clinics. Therefore, the background noise of these environments is naturally included in the train set. However, since the trained model may be used in various places, adding background noise from various environments could be beneficial for model performance. Also, as a long-term goal, utterances of children using different languages could be used in training in order to build a cross-lingual model for SSD detection.
5. Conclusion
In this paper, we presented methods for implementing automatic detection of SSDs in children using state-of-the-art speech recognition models. Pre-trained neural network models such as Whisper are able to generate transcriptions from spoken language and can be fine-tuned for various downstream tasks such as audio classification. We have collected a 4.6-hour speech dataset from Korean children and labeled them as TD and SSD based on analysis and transcriptions from speech pathologists. To build an automatic SSD detection system, we presented five different methods, three with ASR models and two with AC models. The evaluation showed that SSD detection based on word-level audio classification achieved the highest performance measure.
As discussed in the performance evaluation, future studies should aim to improve the ASR and audio classification performance of models in order to increase the reliability of automatic SSD detection systems. Also, since ASR and AC models show different behaviors, combining the benefits of these two approaches has the potential to reach a higher level of performance, which would be an interesting topic for future research.


