1. Introduction
There are seven monophthongs (i, ɛ, ɑ, ʌ, ɯ, u, o) in the actual spoken Seoul Korean language system (e.g., Shin, 2014). Traditionally, the main acoustic properties used to distinguish vowels are formant frequencies, primarily the first two formants. The first formant frequency (F1) is usually inversely related to vowel height and the second formant frequency (F2) is significantly higher for front vowels in acoustic phonetics (Ladefoged & Johnson, 2015).
However, some studies have reported that the F1 and F2 distributions of the Korean vowels /o/ and /u/ overlap, particularly among female speakers, suggesting that these two phonemes are undergoing a merger in production (e.g., Byun, 2018; Han & Kang, 2013; Han et al., 2013; Jang et al., 2015; Moon, 2007; Seong, 2004).
At first, /o/ and /u/ were distinguished by F1 values: /u/ is a high vowel, while /o/ is a mid vowel. At the same time, they share similar F2 values, classifying them both as back vowels (Yang, 1992). However, by the early of 21st century, it was reported that these two vowels were becoming more acoustically similar (Moon, 2007; Seong, 2004). Cho (2003) also examined the first two formant frequencies of /o/ and /u/, revealing a different pattern. In Cho’s study, the two phonemes were differentiated by F2 values.
Seong (2004) concluded that for male speakers, the F1 values of the two phonemes showed a statistically significant difference, preserving the contrast between /o/ and /u/ through F1. In contrast, for female speakers, there were no statistically significant differences in either F1 or F2 values, indicating a merging trend between the vowels. Jang et al. (2015) also found that F1 and F2 values for /o/ and /u/ did not show a statistically significant difference. While these studies argue that F1 and F2 space for /o/ and /u/ are merging or approximating, an alternative view suggest that instead of the two vowels becoming less distinguishable due to their proximity, there has been fronting and lowering of /u/ (Cho, 2003; Kang & Kong, 2016; Lee et al., 2016).
Byun (2018) also explored whether there are other acoustic parameters that differentiate /o/ from /u/ beyond the F1/F2 contrast. The study found that, for female speakers, /o/ and /u/ almost overlap in the F1/F2 space across all age groups, while the H1-H2 values (the difference between the first and second harmonics) showed significant difference between the two vowels, regardless of age. /u/ has significantly higher H1-H2 values than /o/, which means /u/ is more breathy than /o/. Conversely, for male speakers, /o/ and /u/ remained largely distinct in the F1/F2 space, but their H1-H2 values were very similar across all age groups.
In terms of the perception of these two phonemes, one area of research focuses on how F1 and F2 affect perception. Igeta et al. (2014) conducted a perception task to discriminate between /o/ and /u/, showing that participants were more confused by female stimuli. They randomly selected the data of five speakers (3 female, 2 male). All stimuli achieved 100% accuracy on the non-weighted measure, except for one female’s /o/, which scored 95.2%, and another female’s /u/, which also scored 95.2%. The overall accuracy remained high, even when the F1 and F2 distributions overlapped. Yun & Seong (2013) also examined the perception of /o/ and /u/ using F1/F2-manipulated synthetic vowels and found that F2 had a stronger influence than F1 in categorizing the vowel sounds. In contrast, Igeta & Arai (2019) suggested that F2 is not necessarily the dominant factor in distinguishing these two vowels. Both studies used synthetic stimuli, but while Yun & Seong (2013) used male formants, Igeta & Arai (2019) used female formants. Therefore, we can observe that the results of previous studies are inconsistent, or even contradictory.
Another question is whether H1-H2 values are used as perceptual cues for distinguishing /o/ and /u/. Byun (2020) conducted a perception test using stimuli of /o/ and /u/ produced by 41 female speakers, which overlapped considerably in the vowel space. The results showed that H1-H2 values were not significantly involved in the identification process, with formants, especially F2, remaining the dominant cues.
Regarding the direction of the approximation between the two phonemes, it was found that approximately half of the female /o/ tokens were categorized as /u/ (Igeta et al., 2014). Similarly, Byun (2020) found that the identification accuracy for /o/ was 86%, compared to 91% for /u/, further confirming that /o/ is more frequently misperceived by listeners. This suggests that /o/ is more susceptible to sound change in the merging process between the two phonemes. Investigating the direction of this sound change is highly significant.
Multiple co-varying cues for a phonological contrast are often introduced by coarticulation, and sound change occurs when their relative weighting shifts. The central issues for this kind of sound change include how cue weighting shifts over time in both production and perception and what the mapping is between production and perception during this process (Kuang & Cui, 2018). In Kuang & Cui’s study, they found a misalignment between production and perception, with shifts to formant values occurring first in perception, while production lags behind. Following this, we aim to provide further insights into these questions in the present study.
However, previous studies on perception did not examine the differences between female and male speakers, despite the fact that these two groups showed significant differences in production. The goal of the present study is to investigate the perception of /o/ and /u/ by both female and male speakers, after confirming their production distribution. If female speakers tend to merge /o/ and /u/ more than male speakers in production, the question arises: will their perception behave similarly?
Formant frequencies are among the most widely used acoustic parameters for describing vowels. In addition to formant frequencies, other parameters such as spectral slope, fundamental frequency (F0), and vowel duration are also known to play a role in vowel characterization (Byun, 2018; Kent & Read, 1992). We will first conduct a production experiment to examine the F1 and F2 distribution of /o/ and /u/. Since F1 and F2 have been reported to overlap for /o/ and /u/, as mentioned previously, the present study will also investigate differences in voice quality. This aims to identify additional acoustic parameters that may differentiate /o/ from /u/ in production and perception. Specifically, we will analyze the amplitude differences between the first and second harmonics (H1-H2) and between the first harmonic and the first formant (H1-A1), which are commonly used as acoustic indices of voice quality. Higher values of these measures are associated with greater breathiness in the vowel (Garellek, 2013).
After confirming the production distribution, we will conduct a perception experiment to explore whether the perceptual patterns are as unbalanced as they are in production. Additionally, we aim to identify which acoustic cues influence perception and to examine the relationship between the perception and production of /o/ and /u/ by comparing the results of the production and perception tasks.
2. Methods
Ten native Seoul Korean speakers (5 female, 5 male; aged 22–29, M=25.3) participated in production experiment. Sixteen native Seoul Korean speakers (8 female, 8 male; aged 22–30, M=25.6) participated in the perception experiment. Among them, 10 participated in the production task. However, one male participant who only took part in the perception task was reported live in other city for 8 years, and thus his data were excluded from the analysis. Other participants were undergraduate or graduate students who were born and raised in Seoul or Gyeonggi, Korea, and had not lived in other cities for more than two years. Seoul and Gyeonggi region is where standard Korean is spoken. All participants were paid for their participation.
We conducted two experiments, production and perception, using the same target words.
Fifteen minimal pairs of /o/ and /u/ in Korean, without a final stop consonant, were selected, as shown in Table 1. These words were chosen from the Great Standard Korean Dictionary and two native Korean speakers helped confirm that these words are used in life, although a few of them are relatively uncommon.
We conducted the production experiment first. There were 50 items in total, including 30 target words and 20 fillers. Each word was said twice in a carrier sentence: nɛka __ (i) lako malamnida (I say__). The words were presented one by one on a computer screen in a quiet, relatively small room at a university in Seoul. The recordings were made using Praat and a lapel microphone at a sampling rate of 48 kHz. Before recording, participants practiced with three words and were instructed to speak as naturally as possible. This ensured they were familiar with the procedure and at the same time we can check the recording quality. Participants were told they could take a break time at any time during the recording, and the entire experiment took each participant no more than 10 minutes.
We collected a total of 300 tokens (30 target words×10 speakers), and only the second production of each target word was selected. Twenty-nine tokens were excluded in the production analysis. Because F0 could not be measured for some parts of the phonemes and two participants had occasionally extremely high F2 values. And three participants (one female and three male) produced one incorrect word for /o/ vowel. As a result, our perception stimuli consist of a total of 297 tokens.
The perception experiment was conducted using E-prime 3 (Psychology Software Tools, 2016) in a quiet setting similar to the production experiment. It was a two-alternative forced choice task. The recordings of the second time of each target word from the production task were used as stimuli. Participants were told that they would hear one word and choose which word they heard from a pair of minimal pairs, as shown in Table 1. There were 297 trials in total, and participants had unlimited time to respond in E-prime, allowing them to take breaks whenever needed. The 297 trials were split into two blocks, with a mandatory rest period between the two blocks. The task began with three practice trials, and the whole experiment also took each participant no more than 10 minutes.
The F1 and F2 values were automatically extracted using a Praat (Boersma & Weenink, 2019) script. We referenced the DiCanio’s website and modified some parts to fit our goal. In case where F1 and F2 values were too close or the formant frequencies were unstable, we manually extracted the data when necessary. Additionally, H1-H2 and H1-A1 values were measured. Each vowel was divided into three intervals, and since the middle segment is the most stable and least influenced by adjacent consonants and vowels, only the data from the middle segment were used.
We used z-score standardization, implemented in R (R Core Team, 2024), to account for individual differences in formant frequencies. Specifically, z-scores were calculated within each individual’s data rather than across the entire sample. This approach ensures that each individual’s data is centered around their own mean and scaled by their own standard deviation, effectively controlling for individual variability.
A generalized linear model (GLM) were employed to investigate the relationship between the classification of the phonemes /o/ and /u/ and predictor variables (F1, F2, H1-H2 and H1-A1) using lme4 package (Bates et al., 2015) in R (R Core Team, 2024). The model was fitted using a binomial family with a logit link function.
3. Results and Discussion
Figure 1 shows the F1 and F2 distribution of /o/ and /u/ for both female and male speakers. It is evident that the F1 and F2 spaces of both female and male speakers overlap to some extent. The overlap is much more pronounced for female speakers, almost appearing as a merger, which aligns with previous findings in the literature (Byun, 2018; Han & Kang, 2013; Han et al., 2013; Jang et al., 2015; Moon, 2007; Seong, 2004). In this paper, all data marked with ‘.c’ represents z-score normalized values, calculated within each individual’s dataset.
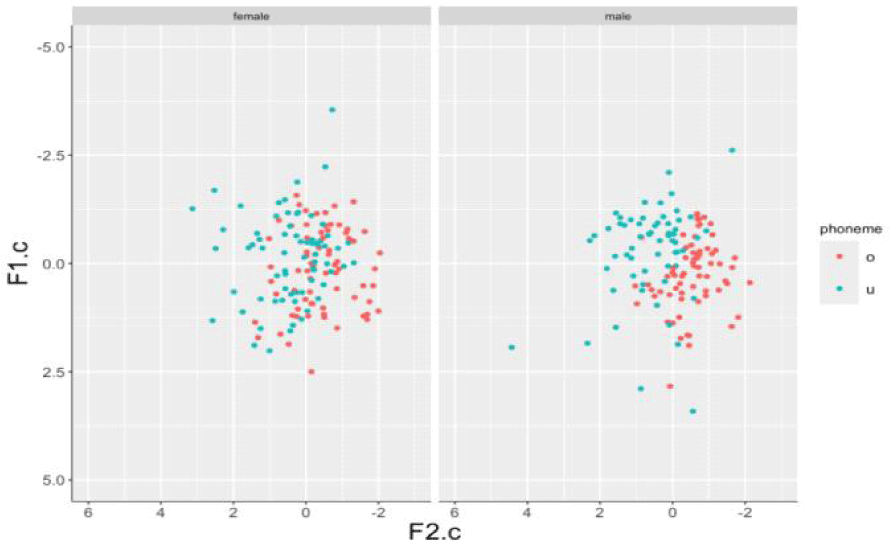
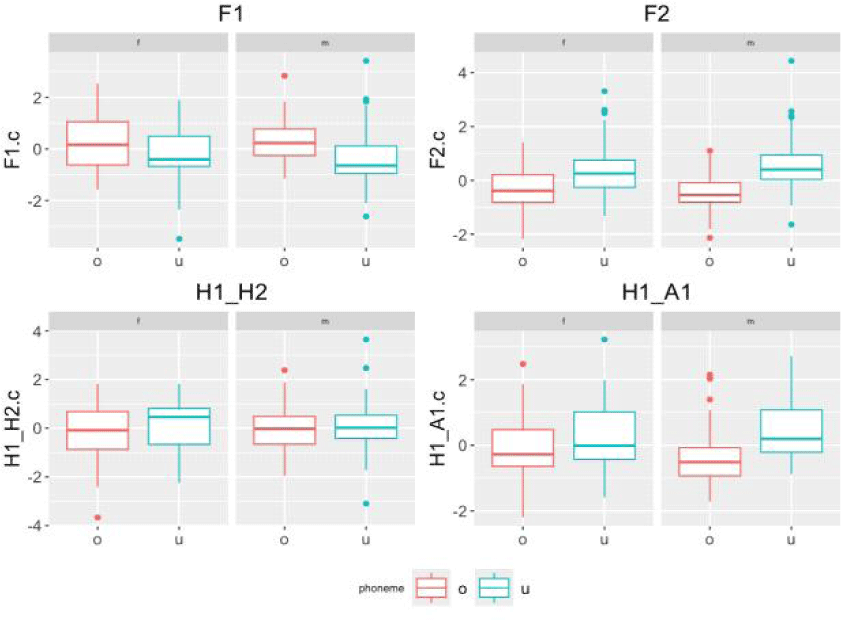
Figure 2 plots the F1, F2, H1-H2, H1-A1 scores of /o/ and /u/ for both female and male speakers. For F1 and F2 values, both female and male speakers exhibit higher F1 values for /o/ and higher F2 values for /u/. However, for H1-H2 values, female speakers demonstrate a greater difference between the two phonemes compared to male speakers. Regarding H1-A1 values, male speakers show higher values for /u/ than /o/, with a more distinct distributional difference than that observed in female speakers.
We then employed a generalized linear model (GLM) including four fixed effects, F1, F2, H1-H2 and H1-A1, to test whether these variables significantly impact the distinction between /o/ and /u/. Initially, we employed a mixed-effects model with ‘subject’ as a random effect. However, the variance for the random intercept was estimated to be zero, which means there is no substantial variation in the intercept across different subjects. Therefore, we adopted a simplified fixed effects model. And the baseline was set as phoneme /o/.
Table 2 presents the estimated coefficients, standard errors, z-values, and p-values for each predictor in the model for female speakers. The GLM results indicate that F1 and F2 are significant predictors of /o/ and /u/ classification, with F2 showing a particularly strong positive effect. In contrast, H1-H2 and H1-A1 do not significantly contribute to the model, suggesting that these parameters do not play a crucial role in /o/, /u/ classification.
| Estimate | SE | z-value | p-value | |
|---|---|---|---|---|
| (Intercept) | 0.002 | 0.193 | 0.008 | 0.9936 |
| F1 | –0.495 | 0.209 | –2.375 | 0.0176* |
| F2 | 1.198 | 0.28 | 4.281 | 1.86e-05*** |
| H1-H2 | –0.061 | 0.277 | –0.219 | 0.8266 |
| H1-A1 | 0.299 | 0.292 | 1.023 | 0.3061 |
Table 3 summarizes the results of GLM fit for male subjects. The analysis reveals that both F2 and H1-A1 are significant predictors of phoneme classification, with F2 showing a particularly strong effect. On the other hand, F1 has a moderate negative effect, and H1-H2 does not contribute significantly to the model.
Since the predictors in the GLM models were standardized (z-scores), the effect sizes of the predictors can be directly interpreted from the coefficients (β). The effect size of F1 is –0.495 (female) and –1.157 (male), F2 is 1.198 (female) and 2.460 (male), and H1-A1 is 0.299 (female) and 1.230 (male). These findings suggest that F2 has the largest effect size in both models, indicating that F2 is the most critical cue for distinguishing /o/ and /u/. For male speakers, the effect size of F2, F1, and H1-A1 is stronger than for female speakers, suggesting more prominent acoustic differences in their speech. The Akaike Information Criterion (AIC) value indicates that the male model (AIC=99.29) fits the data better than the female model (AIC=167.35). All of these suggest that the acoustic differences between /o/ and /u/ are more pronounced and systematically captured in male speech compared to female speech.
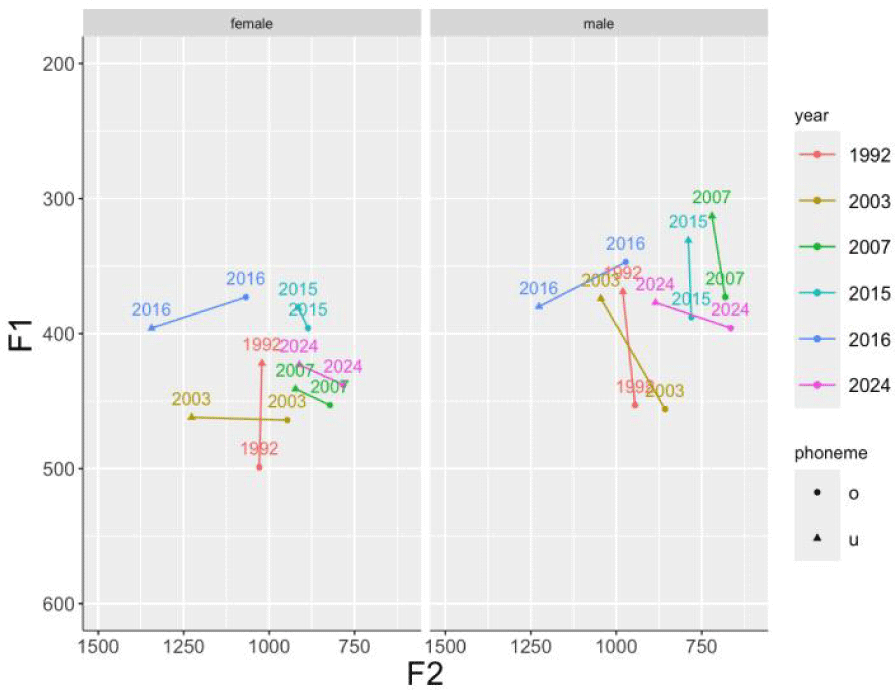
To understand the diachronic change in the F1 and F2 space for /o/ and /u/ comprehensively, we compare the results of this study with those of previous studies. Figure 3 plots the mean F1 and F2 values of /o/ and /u/ at different stages from 1992 to 2024. The data used in Figure 3 come from the following previous studies: Cho (2003), Jang et al. (2015), Lee et al. (2016), Moon (2007), Yang (1992), and the present study. The participants in these six studies are all from Seoul or Gyeonggi region and were mostly in their 20s at the time of the studies.
Figure 3 shows that initially, in the 1990s, F1 was the primary acoustic cue for discriminating /o/ and /u/ for both female and male speakers (Yang, 1992). However, since the early 2000s, female speakers have shifted their reliance on the acoustic cue discriminating the two phonemes from F1 to F2. Additionally, Figure 3 indicates that male speakers also transitioned from using F1 to F2 in the late 2010s, similar to female speakers. In our study, F2 is the most evident acoustic cue for classifying /o/ and /u/ for both female and male speakers. Thus, we conclude that the distinction between /o/and /u/ in Korean has shifted from F1 to F2, despite the ongoing merger process. Although some studies have observed fronting and lowering of /u/ (Cho, 2003; Kang & Kong, 2016; Lee et al., 2016), /o/ may also be raised and shifted towards the /u/ space.
Before conducting the perception experiment, we confirmed that the /o/ and /u/ productions of our female subjects overlapped more than those of male speakers, as shown in Figure 1 and supported by the statistical results. The main goal of perception experiment is to determine whether female subjects perceive the distinction between /o/ and /u/ less accurately than male speakers, as observed in the production task.
Table 4 presents the results of perception task. It shows female speakers have an accuracy of 92.0%, while male speakers only reach 88.9%. This indicates that female speakers perceive the distinction better than male speakers. Additionally, the perception accuracy for the phonemes is 92.9% for /u/ and 88.2% for /o/, revealing that /o/ is more likely to be misidentified than /u/. The finding is consistent with the results of Byun (2020) and Igeta et al. (2014). Our accuracy is slightly higher than that of Byun (2020), possibly because we provided only two options for our responses, which increases the chance level.
| Accuracy (%) | ||
|---|---|---|
| Subject gender | Female (n=2,376) | 92.0 |
| Male (n=2,079) | 88.9 | |
| Phoneme | u (n=2,250) | 92.9 |
| o (n=2,205) | 88.2 | |
Figure 4 plots the production accuracy of individual speakers against their perception accuracy. We plotted Figure 4 to examine the relationship between production and perception, specifically to investigate whether subjects who produce the two phonemes more distinctly also perceive them more clearly. Figure 4 shows that individual speakers’ perception and production are positively correlated, which means speakers who produce these two phonemes more distinctively tend to perceive them better. However, it is important to note that Subject 1 is an outlier, positioned far from others, which affect the results; thus, the correlation may not be as strong as it appears. The relatively small sample size in this study means that our conclusions may not be definitive, but the data does suggest a trend.
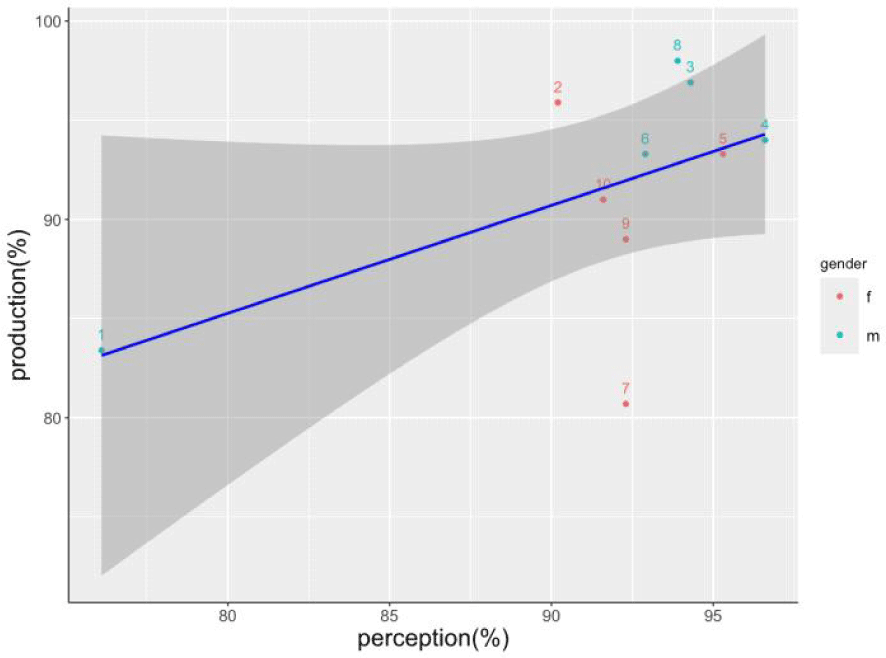
In Figure 4, coral red points represent female speakers, while turquoise points represent male speakers. Although the previous results (see Table 4) indicate that female speakers perceive better than male speakers, Figure 4 shows that female speakers generally have lower perception accuracy than male speakers, with the exception of Subject 5. Additionally, Subject 1, a male speaker, is separated from the other male subjects by female subjects in the plot and has both the lowest perception accuracy and the second-lowest production accuracy. From this, we can conclude that the low perception accuracy among male subjects is influenced by Subject 1. Therefore, it is difficult to definitively state that female speakers perceive better than male speakers.
At the same time, we can see from Table 5, which shows the accuracy of production, that even though Subject 1 (a male speaker) exhibits the second-lowest production accuracy, male speakers still have higher accuracy than female speakers in production. This finding is consistent with the results predicted by our previous model (Section 3), which indicated that male speakers are better at distinguishing between the two phonemes than female speakers. Therefore, we can conclude that male speakers discriminate between the two phonemes better than female speakers in terms of production, but the imbalance is not as significant in perception.
| Accuracy (%) | ||
|---|---|---|
| Gender (for stimuli) | Female (n=2,235) | 88.6 |
| Male (n=2,220) | 92.0 | |
Although the sample size in this study is relatively small, it is evident that male speakers also confuse /o/ and /u/, similar to Subject 1. We then sought to investigate which acoustic cues affect the perception of /o/ and /u/. The bottom part of Figure 5 shows the distribution of four acoustic cues for stimuli that all 10 participants correctly identified, while the top part of Figure 5 shows the distribution for stimuli for which at least three participants chose incorrectly.
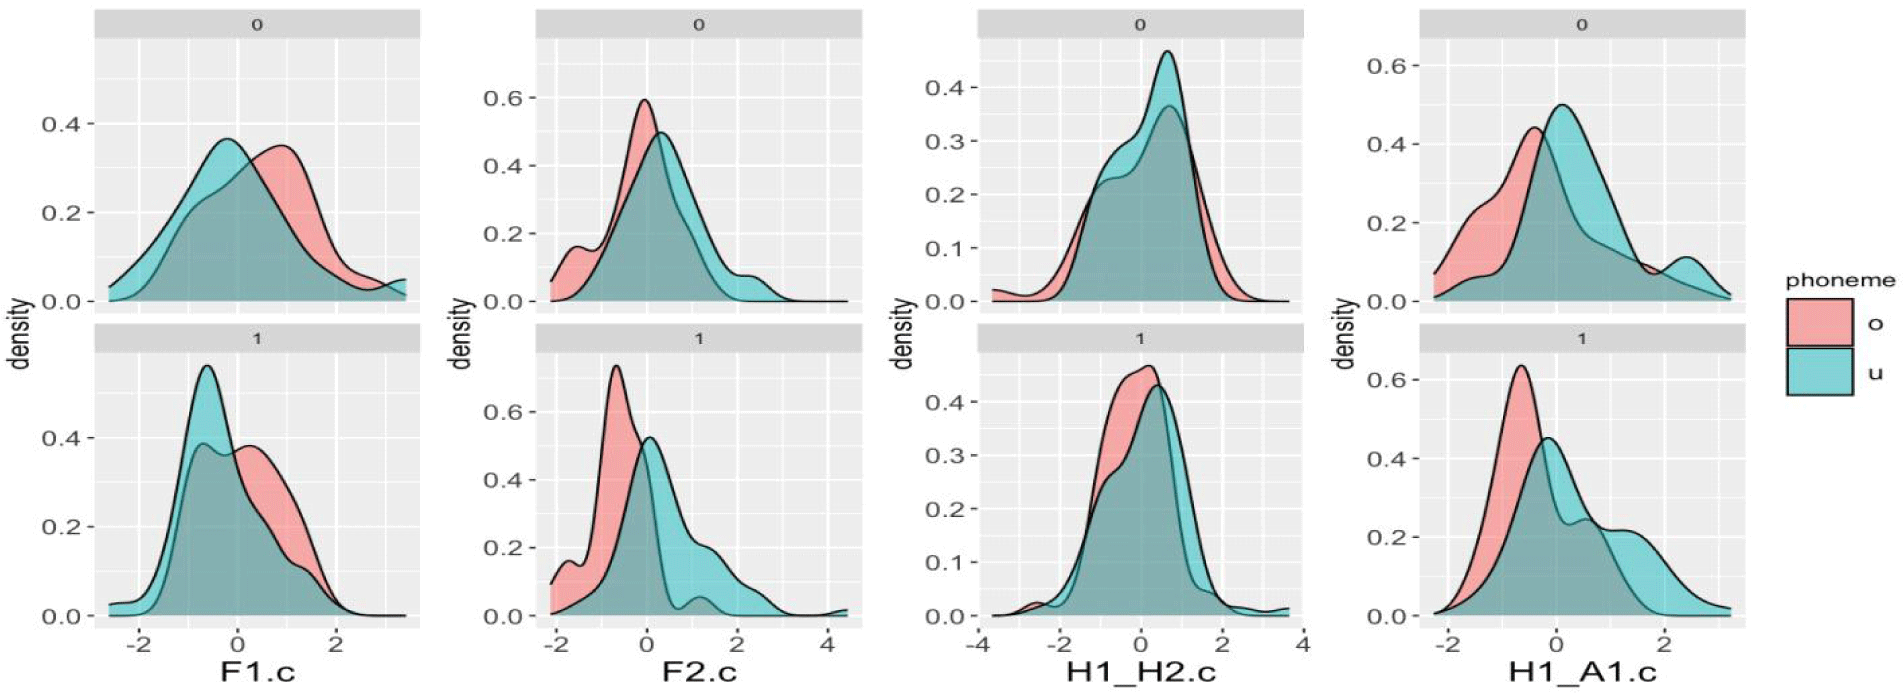
Figure 5 indicates that F2 value is useful cue for perceiving /o/ and /u/. Although H1-A1 is significant for discriminating /o/ and /u/ in production, Figure 5 shows that it is not as important in perception. The F2 value is significant for both female and male speakers in production and is also the most evident cue for classifying the two phonemes in perception. On the other hand, it indicates that the statistical results do not necessarily reflect what people actually perceive. We will discuss these results further in the next section.
Furthermore, as shown in Figure 5, the F2 value of /u/ mostly remain at the same position in both the accurate responses (bottom) and the error responses (top). The perceptual merger occurs because the values of /o/ shift from their original position (bottom) to align with the /u/ position (top), which is consistent with Table 4, where /o/ is shown to be more likely misidentified.
This study examined the asymmetry in the production and perception of Korean vowels /o/ and /u/ across genders, which are reported to be undergoing sound change. It specifically explored how cue weighting shifts occur during this change and investigated whether there is a balance between production and perception. The results contribute to understanding the broader theoretical framework of sound change and variation.
One of the basic findings of the present study reveals that male speakers do not always discriminate the two phonemes better than female speakers in perception, despite the fact that male speakers produce the two phonemes much more clearly than female speakers. This is one asymmetry between the production and perception in the /o/, /u/ sound change.
The mapping of production and perception has become a central issue in sound variation and change, and one of the key questions is the direction of misalignment, i.e., which domain goes first, and how the contexts of variation influence this relationship (Yin, 2024). Previous studies, such as Kuang & Cui (2018), found that perception leads the change in language-internal shifts. Our results show that male speakers’ production may initially drive the change, as the H1-A1 value exerts a noticeable influence on production while having no effect on perception, which is consistent with Yin (2024)’s findings.
From the production results, we observe that the two phonemes overlap significantly in the vowel space. Therefore, we also want to discuss that the possibility that whether they will merger completely, like /ㅔ/ and /ㅐ/ (/ɛ/) in Korean, or whether other cues will be used to discriminate them. Literature suggests that the two phonemes may shift their acoustic cue from the F1 value to the F2 value for discrimination. However, they are still quite similar to each other at this time. Additionally, Byun (2018) concluded that, for female speakers, the H1-H2 values showed a significant difference between the two vowels. Although our results did not show this, it may due to the differences in research methods and other factors that influenced the results. We find that H1-A1 may serve as an acousticcue for discriminating /o/ and /u/ for male speakers. The mean H1-A1 value for /u/ is significantly higher than that for /o/, indicating that Korean /u/ is more breathy than /o/. Even for female speakers, the mean H1-H2 and H1-A1 values for /u/ are higher than weighting in production and perception, as well as the imbalance between genders. Our production results align with previous studies, indicating that /o/ and /u/ are near-mergers in the F1 and F2 space, with female speakers leading the change. However, our perception results reveal that this pattern is not reflected in perception; female speakers show 92.0% accuracy, while male speakers show 88.9%. Additionally, we found that F2 is the most prominent cue for the perception of /o/ and /u/. The current study has a limited number of participants, as we first required all participants (except five additional participants for perception task) to complete the production experiment before designing the perception experiment, necessitating their return for the latter, which is a complicated process. Nonetheless, our findings offer valuable insights into the sound changes of /o/ and /u/ in Korean, especially the cue shifting in sound change.
Those for /o/, which is consistent with Byun (2018). These results suggest that voice quality may become increasingly important in the classification of /o/ and /u/. However, this process requires time.
Another finding of the present study is that /o/ is more likely to be misidentified both in production and perception. It appears that /o/ may be produced more similarly to /u/. Recently, in spoken Korean, people often pronounce /o/ in coda positions as /u/. Ahn (2023) found that in the Seoul Corpus, a naturally occurring speech corpus, this substitution occurs over 40% of the time. This may also be one reason why these two phonemes show some ongoing merger in production. If they merge completely in the future, we predict that /o/ may be substitute.
Finally, the perceptual results also provide evidence that F2 value is the most significant cue in classifying these phonemes. Some research has reported that pitch and duration are significant for perception. Wade (2017) found that duration influences vowel categorization and is utilized more extensively when spectral cues are diminished or unavailable. Although we measured the pitch and duration data, neither was significant for the discrimination of the two phonemes in either production or perception, so we did not include this data in this paper.
In this paper, we did not consider the dialectal variations. There is a phonological phenomenon called ‘o-u’ high vowelization in some Korean dialects, which may also influence the sound change of these two phonemes. It would be interesting to investigate the relationship involved in this change. In conclusion, it is important to consider how production and perception are mapped and the cue weighting shifts during sound variation and change.
4. Conclusion
In this study, we investigated the production and perception of /o/ and /u/ by both female and male speakers to examine the cue weighting in production and perception, as well as the imbalance between genders. Our production results align with previous studies, indicating that /o/ and /u/ are near-mergers in the F1 and F2 space, with female speakers leading the change. However, our perception results reveal that this pattern is not reflected in perception; female speakers show 92.0% accuracy, while male speakers show 88.9%. Additionally, we found that F2 is the most prominent cue for the perception of /o/ and /u/.The current study has a limited number of participants, as we first required all participants(except five additional participants for perception task)to complete the production experiment before designing the perception experiment, necessitating their return for the latter, which is a complicated process. Nonetheless, our findings offer valuable insights into the sound changes of /o/ and /u/ in Korean, especially the cue shifting in sound change.


