1. Introduction
Spectral moments analysis examines the energy distribution across the sound spectrum, derived from fast Fourier transforms (FFTs). The first four statistical moments can be computed from the FFTs, which treat spectra as random probability distributions (Forrest et al., 1988). The first moment (M1), center of gravity, represents the mean frequency, where spectral energy is evenly distributed on both sides of a divided frequency axis. The second moment (M2), standard deviation, means how much the spectral energy deviates from the center of gravity. The third moment (M3), skewness, indicates the asymmetry of the energy distribution, which also refers to the overall slant of the energy distribution (Jongman et al., 2000). A zero value of skewness signifies a symmetrical distribution around the mean. When skewness is positive (+), energy is concentrated in lower frequencies with a long tail of the distribution extending to the right, suggesting a negative tilt. On the contrary, negative (–) skewness describes energy concentrated in higher frequencies. It has a long tail of the distribution extending to the left and has a positive tilt. The fourth moment (M4), kurtosis, reflects the peakedness or sharpness of the distribution: A positive (+) value describes a more peaked distribution with well-defined peaks, whereas negative (–) kurtosis suggests a relatively flat distribution without clearly defined peaks. In this way, spectral moments analysis captures local and global (spectral shape) aspects of speech sounds through a statistical procedure (Jongman et al., 2000). This analysis is particularly useful for investigating the spectral energy characteristics of aperiodic waves in obstruents, such as the release burst of stops and the frication noise of fricatives (Park & Seong, 2022). It can also provide insights into the configuration of the articulators during speech production (Taylor et al., 2020). Alveolars such as /s/, for example, tend to have higher values for M1 because a short front cavity leads to energy concentration in higher frequencies. Bilabials like /p/ tend to indicate lower values for M1 as they are produced with the whole oral cavity, whose spectral energy is distributed in lower frequencies (Park & Seong, 2022).
Early studies using spectral moments primarily focused on classifying English obstruents (Forrest et al., 1988; Jongman et al., 2000; Nissen & Fox, 2005). Forrest et al. (1988) did an exploratory study to classify English voiceless obstruents across place of articulation. The authors conducted a discriminant analysis and reported that an average of 92% of the voiceless stops were accurately classified using M1, M3, and M4. Jongman et al. (2000) later found that four spectral moments served to differentiate all four places of English fricative articulation, with M2 and M3 performing the best.
A lot of investigations have also utilized moments analysis to describe and/or classify Korean obstruents (Han, 2016; Heo & Seong, 2015; Hwang, 2004; Kim & Seong, 2018; Park, 2003; Park & Seong, 2022; Yoon, 2020). Park’s findings (2003) showed that M1 and M3 of the spectra of the release bursts did not distinguish phonation types for the Korean alveolar stops. However, regarding discriminating places of articulation of Korean stops, Park & Seong (2022) stated that M1 and M3 of the release bursts were significant parameters. Yoon (2020) measured four spectral moments for Korean stop consonants at the release burst, the post-burst aspiration, and the following vowel onset. Yoon concluded that the four moments at every location that they were measured contributed to classifying Korean stops.
As for Korean sibilants (fricatives and affricates), Hwang’s study (2004) indicated a significant difference in M1 values between phonation types (lax and tense) for sibilants. A Significant difference was not found in M1 between fricatives followed by /i/ and affricates, which could suggest that the place of articulation of fricatives preceding /i/ and that of affricates are the same. Han (2016) reported that all four spectral moments did not distinguish between Daegu and Jeju dialects. However, they were robust cues to differentiate between fricatives /s/ and /s’/, and the values were different in relation to the following vowels. The values of M1 for /s/ and /s’/ were higher when followed by /e/ or /a/ than /i/. The values of M2 and M3 for fricatives were lower and higher, respectively, when followed by /i/. Also, M4 values were lower before rounded vowels than non-rounded ones.
However, the overall knowledge on spectral moments analysis for all Korean consonants still remains limited. Previous studies on spectral moments have predominantly focused on analyzing specific obstruents because the parameters are known for describing obstruents effectively. Some studies on other languages have investigated sonorants using spectral moments (Tabain & Kochetov, 2018; Tabain et al., 2016a, 2016b; Themistocleous, 2019; Themistocleous et al., 2022), offering valuable insights for further research on Korean sonorants. Themistocleous (2019) combined spectral moments, temporal information, and formant frequency data of sonorants to classify two Greek dialects. The results showed that a deep neural network (DNN) model achieved a classification accuracy of 81%. While this study did not rely solely on spectral moments, they played a significant role as part of the classification parameters. Building on this, we chose to use spectral moments to examine whether they can be effectively utilized as parameters for distinguishing Korean obstruents and sonorants. The aims of the current study are as follows:
-
(1) Identify unique patterns of acoustic energy of Korean consonants (including both sonorant and obstruent consonants) as a function of gender, manner of articulation, and vowel context, by analyzing four spectral moments (M1, M2, M3, M4) and two slope-related parameters of the spectral energy distribution (slope_ltas and tilt).
-
(2) Examine the correlations between the six spectral measures for each manner of articulation using Pearson correlation analysis.
-
(3) Utilize a generalized linear model (GLM) to determine how well the six spectral measures classify Korean consonants into two categories: obstruents and sonorants.
2. Data and Method
The data for this research were drawn from the Seoul Corpus (Yun et al., 2015), which includes interview-style, spontaneous speech recordings from 40 speakers. All participants were native Korean speakers with Seoul accents, and their ages ranged from their 10s to their 40s. We selected speech samples from 20 speakers in their 20s and 30s, as voices in these age groups are generally considered healthy and stable throughout the lifespan. This research was certified as exempt by the Institutional Review Board (IRB) at Chungnam National University (202309-SB-159-01).
Consonant-vowel (CV) sequences were selected from the Seoul Corpus recordings (Table 1). Consonants were categorized based on their manner of articulation and were followed by five vowels /a, e, i, o, u/. The vowel /e/ encompasses both /ɛ/ and /æ/, likely to be merged into a single sound in modern Korean. A total of 146,837 tokens were extracted.
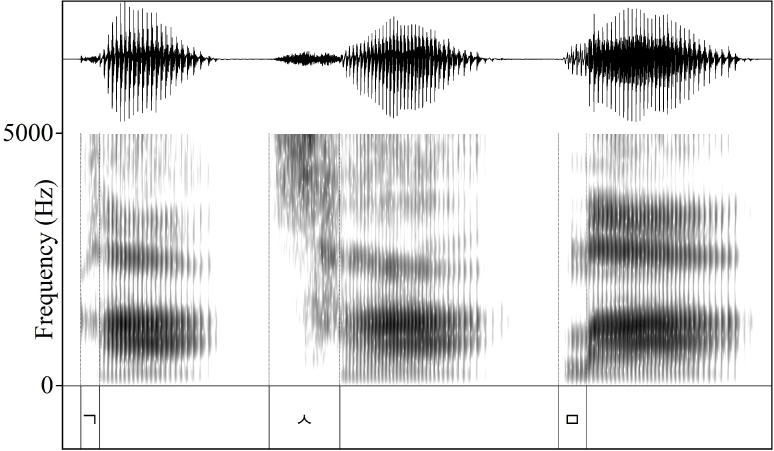
The entire analysis was conducted using Praat software (ver. 5.3.14 and 6.1.16; Boersma, & Weenink, 2012, 2020) and followed the procedures outlined by Forrest et al. (1988) with some modifications. The first 10 ms from the onset of each consonant were extracted using a rectangular window. This segment captures the onset of the release burst for stops. Using this segment as a reference, all consonants were analyzed over the same duration. The extracted segments were then pre-emphasized above 50 Hz to enhance the resonant effects of the vocal tract. The time-domain signals (see Figure 1) were converted into sound spectra using FFTs (see Figure 2). The first four spectral moments were then measured from the spectrum with a default power of 2.0.

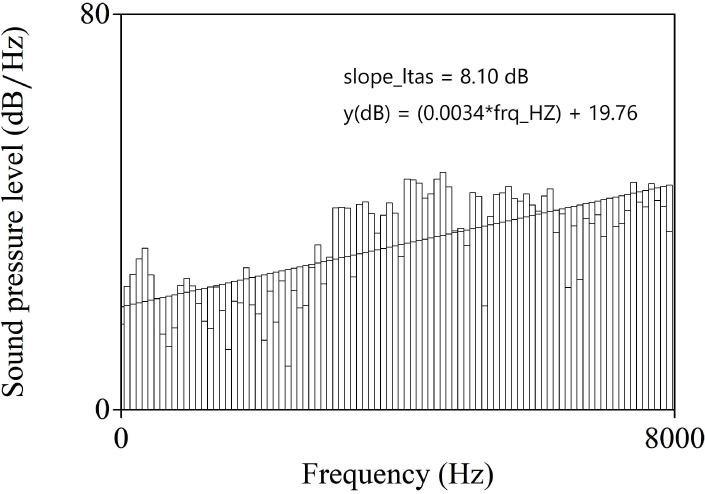
In addition, we utilized two other slope-related parameters of the spectral energy distribution: slope_ltas and tilt. These variables are useful as they provide a clear overview of the overall slope of the energy contour. Slope_ltas refers to the difference in dB between the average energy in high- and low-frequency areas. Tilt represents the average slope of the spectral regression line within a specific frequency band. These parameters were calculated from the long-term average spectrum (LTAS) 1-to-1 object generated from the FFT sound spectrum. Slope_ltas was computed using two frequency ranges: 0 to 4 kHz for the low-frequency area and 4 to 8 kHz for the high-frequency area. Tilt was measured over the 0 to 8 kHz frequency range on a linear scale (see Figure 3 for the LTAS 1-to-1 object, transformed from the [sa] spectrum). The tilt values in the results section were multiplied by 1,000 to handle the decimal places.
First, linear mixed-effects (LME) models were performed using R (ver. 4.4.1; R Core Team, 2024). Fixed factors included gender, manner of articulation, and vowel context, while subject was included as a random factor to account for variability among speakers. We constructed six separate LME models to test the effects of gender, manner or articulation, and vowel context on the variables M1, M2, M3, M4, slope_ltas, and tilt, respectively, using the lmer function from the lmerTest and lme4 packages. Bonferroni post hoc tests were conducted using the emmeans function. Due to the large corpus data used in this study, asymmetric degrees of freedom were computed with the lmer.df=“asymp” argument added to the emmeans function.
Second, Pearson correlation analysis was conducted using SPSS ver.23 (IBM, Armonk, NY, USA) to examine the correlations between the six dependent variables for each manner of articulation.
Lastly, the data were binary classified into obstruents and sonorants based on the six acoustic parameters. Initially, a logistic regression model was performed on the entire dataset in SPSS, resulting in an overall classification accuracy of 72.1%. The classification accuracies were 92.1% for obstruents and 22.9% for sonorants. To address the imbalance, random sampling of 40,000 instances from each group (out of the total 104,381 obstruents and 42,456 sonorants) was performed in R. The data were then divided into training and test sets in a 60:40 ratio, and a GLM was constructed. This process was repeated in 100 loops, and the mean classification accuracy of the test data was calculated.
3. Results
Six LME models were constructed with gender, manner of articulation, and vowel context as fixed effects, subject as a random effect, and spectral measures as dependent variables. A significance level of 0.05 was used. Subsequent post hoc tests focused mainly on the interactions between gender, manner of articulation, and vowel context.
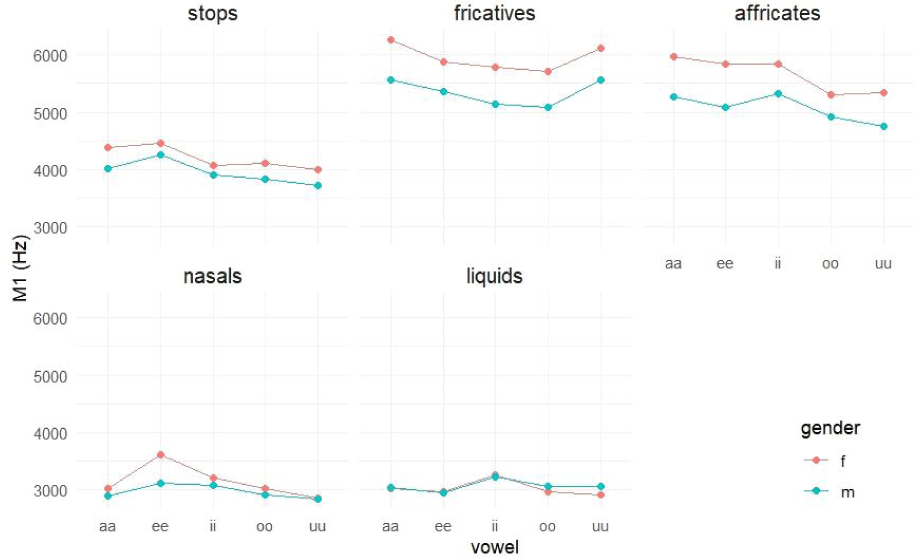
For M1, a main effect was obtained for gender [F(1,18)=7.538, p<0.05], manner of articulation [F(4,146769)=6,726.938, p<0.001], and vowel context [F(4,146770)=63.866, p<0.001]. Additionally, a significant gender×manner×vowelinteraction [F(16,146770)=5.791, p<0.001] was observed, according to the type 3 ANOVA table, using Satterthwaite’s method. The likelihood ratio test (LRT) for the random variable was also significant (LRT[1]=2,676, p<0.001). For random effects, the standard deviation was 259.5, and the intraclass correlation coefficient (ICC) was 0.0213. The marginal R-square and conditional R-square values were 0.206 and 0.223, respectively.
In the interactions involving gender×manner×vowel (Figure 4), 1) females generally had higher M1 values than males for obstruents, with a significant level of 0.1 for the vowel /e/. For sonorants, there were no significant differences between gender groups, except for nasals followed by an /e/ vowel. 2) In terms of manner of articulation, both genders showed a decreasing M1 pattern in the order of [fricatives>affricates>stops>{nasals≒liquids}]. In males, significant differences in M1 were observed for all five manners of articulation when preceding /a, i/ vowels. 3) For vowel context, both gender groups exhibited the highest M1 values in the following contexts: stops preceding /e/, fricatives preceding /a/, affricates preceding /a, i/, nasals preceding /e/, and liquids preceding /i/.
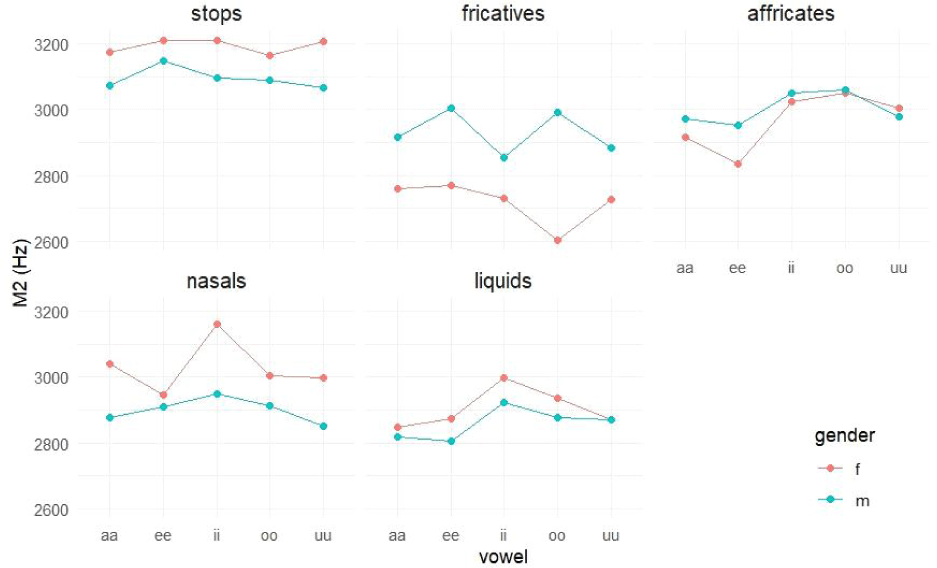
A significant main effect of manner of articulation [F (4,146771)=722.511, p<0.001] and vowel [F(4,146772)=30.228, p<0.001] was found for M2. A significant gender×manner×vowel interaction [F(16,146772)=3.626, p<0.001] was obtained from the LME model. LRT was also significant (LRT[1]=1,134, p<0.001). The standard deviation for random effects was 67.47, with an ICC of 0.0093. The marginal R-square and conditional R-square values were 0.032 and 0.041, respectively.
Post hoc tests for the interaction (Figure 5) revealed the following: 1) There were few significant differences in M2 between gender groups for affricates and liquids. Females typically had significantly higher M2 than males for stops (/e/ with a significance level of 0.1) and nasals, while males exhibited higher M2 than females for fricatives. 2) In females’ speech preceding /a/, all manners of articulation were distinguished, following a decreasing M2 pattern of [stops>nasals>affricates>liquids>fricatives]. 3) For fricatives, both genders had the highest M2 in an /e/ context, with the lowest values in /o/ for females and /i/ for males. Affricates, which had the highest values when followed by /i, o/ and the lowest when followed by /e/, displayed an opposite trend compared to fricatives.
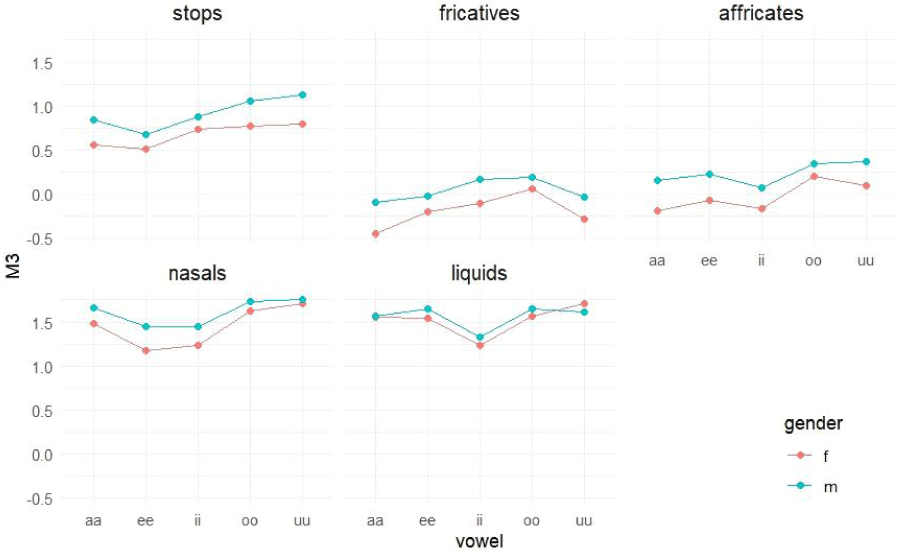
Significant differences in spectral skewness were found across gender [F(1,18)=4.687, p<0.05], manner of articulation [F (4,146770)=3,587.114, p<0.001), and vowel [F(4,146770)=74.355, p<0.001], along with a significant gender×manner×vowel interaction [F(16,146770)=3.875, p<0.001]. The LRT was also significant (LRT[1]=2,125, p<0.001), with a standard deviation for random effects of 0.194 and an ICC of 0.0169. The marginal R-square value was 0.125, while the conditional R-square value was 0.139.
Subsequent pairwise comparisons (Figure 6) indicated that: 1) For obstruents, male speakers generally produced significantly higher M3 than female speakers (stops and fricatives in the /e/ context with a significance level of 0.1), following the opposite pattern compared with M1. 2) In terms of manner of articulation, spectral skewness for consonants preceding an /e/ vowel in male speech distinguished all five manners of articulation, following a decreasing pattern of [liquids>nasals>stops>affricates>fricatives]. 3) Collapsed across gender, M3 values were low in the following contexts: stops preceding /a, e/, fricatives preceding /a/, affricates and nasals preceding /e, i/, and liquids preceding /i/.
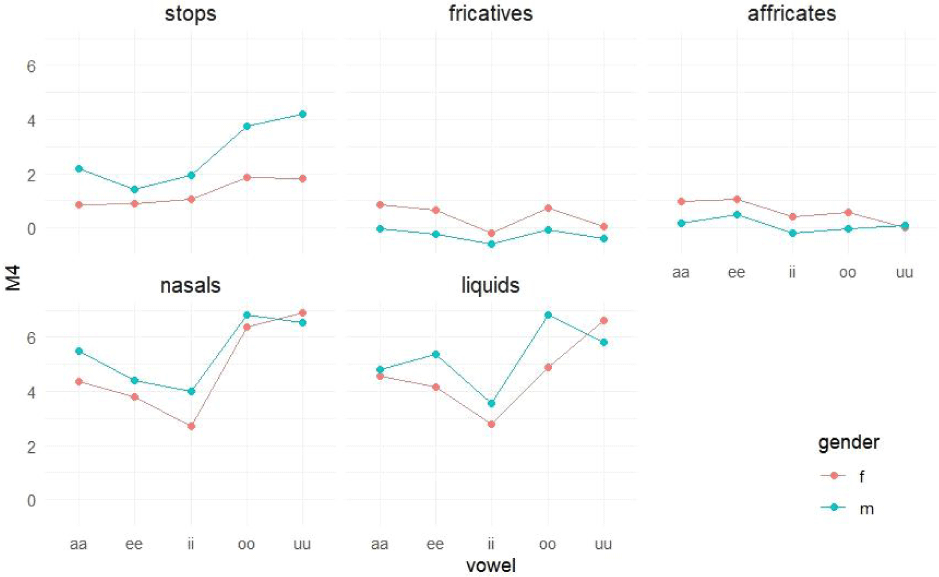
The LME analysis revealed a significant main effect of manner of articulation [F(4,146772)=610.122, p<0.001] and vowel context [F(4,146773)=51.507, p<0.001] on spectral kurtosis. A significant gender×manner×vowel interaction effect [F(16,146773)=2.958, p< 0.001] was found. The LRT was also significant (LRT[1]=896, p<0.001), with a standard deviation for random effects of 1.016 and an ICC of 0.0073. The marginal R-square and conditional R-square values were 0.026 and 0.033, respectively.
Post hoc analyses (Figure 7) showed that: 1) Differences between females and males were not significant in most cases. 2) In every vowel context, spectral kurtosis followed the pattern of [sonorants> obstruents]. Consonants were not significantly distinguished among sonorants or among obstruents. 3) No significant differences in spectral kurtosis were found across all five vowel contexts for sibilants (fricatives and affricates). However, spectral kurtosis was higher when rounded vowels followed stops, nasals, and liquids.
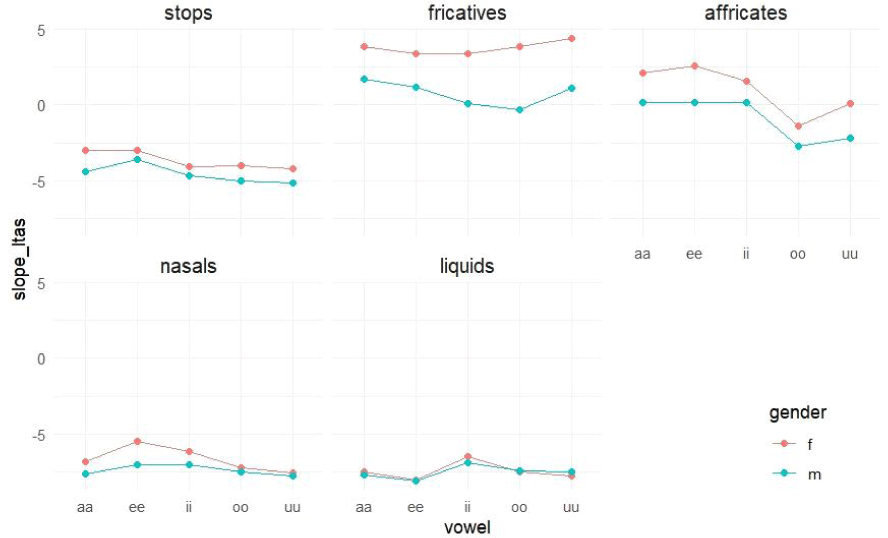
A significant main effect of gender [F(1,18)=11.215, p<0.01], manner of articulation [F(4,146770)=6,807.704, p<0.001], and vowel context [F(4,146771)=90.110, p<0.001] was also found in the measure of slope_ltas. In addition, a significant gender×manner× vowel interaction was noted [F(16,146771)=8.458, p<0.001]. The LRT was also significant (LRT[1]=2,859, p<0.001). The standard deviation for random effects was 0.885, and the ICC was 0.0224. The marginal R-square was 0.211, and the conditional R-square was 0.229.
Subsequent pairwise comparisons (Figure 8) revealed the following: 1) Female speakers generally exhibited higher slope_ltas than male speakers. Significant differences between genders were not found for liquids. For fricatives and affricates, which mostly had positive values, females had greater differences in energy between high- and low-frequency areas than males. Conversely, for stops and nasals, which had negative values, the energy differences between the two frequency areas were greater for males than for females. 2) The slope_ltas generally decreased in the order of [fricatives>affricates> stops>{nasals≒liquids}]. Distinctions in the manners of articulation were evident in females’ /a, e/ contexts and in males’ /e/ contexts. 3) Regarding vowel context, the slope_ltas was highest when fricatives preceded /u/ and affricates preceded /e/. The positive values in these cases indicate large differences in energy between high and low frequencies. On the other hand, the slope_ltas values were highest and negative when stops and nasals preceded /e/ and liquids preceded /i/. This suggests that the differences in energy between the two frequency areas were relatively small in these contexts.
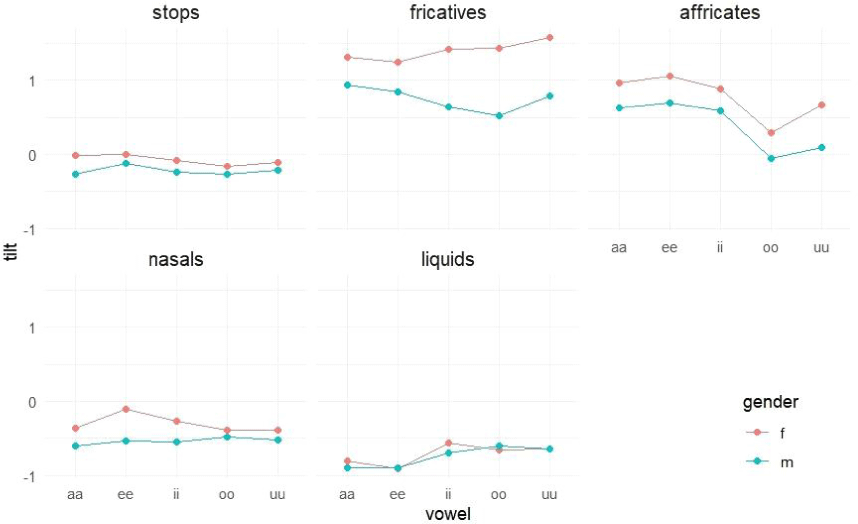
For the measure of tilt, the analysis revealed a significant main effect of gender [F(1,18)=17.016, p<0.01], manner of articulation [F(4,146770)=6,233.231, p<0.001], and vowel [F(4,146771)= 49.098, p<0.001], as well as a significant gender×manner×vowel interaction [F(16,146771)=18.365, p<0.001]. The LRT was significant (LRT[1]=3,022, p<0.001). In addition, the standard deviation for random effects was 0.156, and the ICC was 0.0229. The marginal R-square value was 0.207, and the conditional R-square value was 0.225.
Post hoc comparisons (Figure 9) demonstrated that: 1) Generally, females produced higher tilt than males. Significant gender differences were not observed for liquids. For sibilants, positive tilt values indicated that the regression line for females increased more steeply than for males. In contrast, for stops and nasals, negative tilt values suggested that the regression line for females declined more gradually than that for males. This pattern mirrors the trend observed in the slope_ltas results. 2) All five manners of articulation were different from each other in most contexts, following a decreasing pattern of [fricatives>affricates>stops>nasals>liquids]. 3) High tilt values were found in the following contexts: /u/ for females’ fricatives, /a/ for males’ fricatives, and /e/ for affricates. These positive values indicate a steep increase in the regression line. Conversely, high tilt values were observed when stops and nasals preceded /e/, and liquids preceded /i, o, u/. The negative values in these contexts suggest a gradual decline in the regression line. These patterns were consistent with those observed in the slope_ltas data.
Pearson correlation analysis examined the relationships between the six dependent variables for each manner of articulation (see Appendix 1). The results revealed high and significant correlations between all pairs of acoustic variables for stops, except M2-tilt. For fricatives, significant and high correlations were observed between most pairs, except for M1-M4, M2-M3, M3-M4, M4-slope_ltas, and M4-tilt. Significant correlations for all pairs were found among the acoustic variables for affricates, although low correlations were noted between M1-M2, M1-M4, M2-M3, M3-M4, M4-slope_ltas, and M4-tilt. For nasals and liquids, high and significant correlations were observed across all variable pairs.
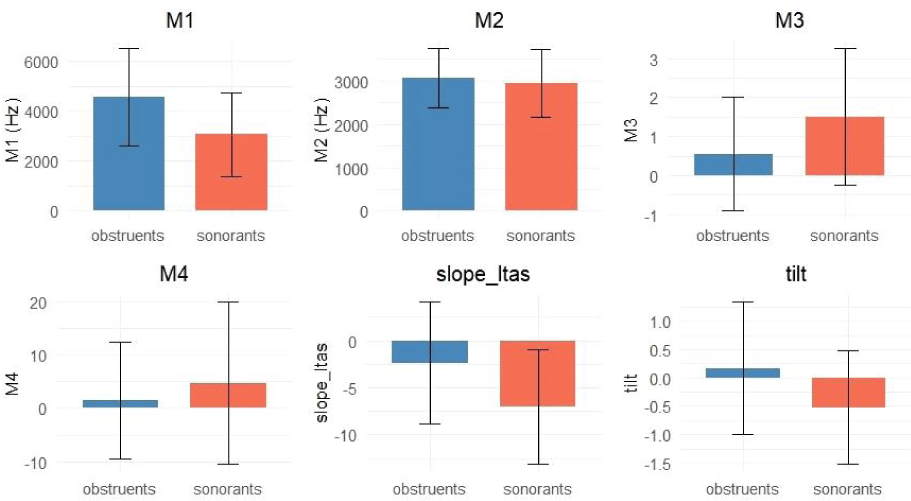
We sampled 40,000 instances from each group of obstruents and sonorants (out of 104,381 obstruents and 42,456 sonorants). After splitting this sampled data into training and test sets with a 60:40 ratio, we calculated the classification accuracy for the training data using the six acoustic variables. The overall classification accuracy for the training data was 67.13%, with obstruents correctly classified 64.69% of the time and sonorants classified 69.57% of the time. For the test data, the overall classification accuracy was 67.67%, with obstruents correctly classified 65.44% of the time and sonorants classified 69.91% of the time. The GLM yielded significant results (p<0.001). All of the six variables showed significant Wald statistics, with skewness and tilt being the most influential variables, having odds ratios of 0.7291 and 0.8272, respectively (Table 2). Figure 10 presents bar plots showing the descriptive statistics of data classified into obstruents and sonorants for each variable.
4. Discussion
This study examined the spectral characteristics of Korean consonants as a function of gender, manner of articulation, and vowel context, utilizing spectral measures. For obstruents, gender differences in spectral characteristics were observed in reverse patterns between M1 and M3. Specifically for stop consonants, females had higher M1 and M2 values and lower M3 values than males. This suggests that the energy in females’ speech is more concentrated in the higher frequency range and is distributed more broadly. Additionally, the slope_ltas and tilt parameters indicated that the energy slope for females declined more gradually. For sibilants, M1 and M3 revealed that the acoustic energy for females was more concentrated in higher frequencies, likely due to differences in oral cavity size. The slope_ltas and tilt also showed that the energy slope for females increased more steeply than that for males. In the case of nasals, females had a more gradual slope decline than males, as indicated by the slope_ltas and tilt. Thus, females tended to concentrate their energy at higher frequencies compared to males when producing obstruents and nasals. Previous research on fricatives has reported gender differences in spectral measures (Flipsen et al., 1999; Jongman et al., 2000; Taylor et al., 2020). Taylor et al. (2020) stated that females had higher M1 and M4 values for /s/ than males. Jongman et al. (2000) reported that females exhibited higher M1, M2, M4 values and lower M3 values than males for English fricatives. Unlike previous studies, this study found that M4 did not show a significant difference between genders. Also, the significant parameters differed across studies, which may be due to differences in speech materials and data processing procedures.
The present study found that female speakers displayed energy concentrated in the higher frequency ranges across all consonant categories, except for liquids. This difference is probably due to the generally smaller oral cavity size of female speakers. However, the lack of gender differences in liquids suggests that the small air pocket on top of the tongue, which leads to anti-resonance, is expected to show minimal variation between genders. Also, the size of the lateral airflow passage is not likely to differ significantly between males and females. While there may be gender differences in the flap [ɾ], which is articulated similarly to the stop [d], this study grouped flap [ɾ] and lateral [l] together as a single category of liquids. Therefore, it is unlikely that such differences would be observed in this analysis.
Regarding the manner of articulation, the values for M1 and slope_ltas showed a decreasing pattern: [fricatives>affricates> stops>sonorants]. The pattern for tilt followed a similar trend, which were ranked as [fricatives>affricates>stops>nasals>liquids]. This trend was the opposite of what was observed for M3. The values of liquids and fricatives lie at opposing ends of the spectrum, although they have similar places of articulation (alveolar and alveolo-palatal). This contrast arises from differences in the resonating cavities. Alveolar fricatives produce a narrow front cavity in front of the place of articulation. The resonances associated with the front cavity dominate the sound spectrum, and the length of the front cavity is a major determinant of the spectrum (Jongman, 2024). When producing liquids (especially lateral [l]), on the other hand, a pocket of air on top of the tongue serves as a side branch that curves around one or both sides of the tongue. This side branch introduces an anti-resonance in the output spectrum (Johnson, 2011). These differences in the resonating cavities and airflow patterns between fricatives and liquids influenced the variables M1, M3, slope_ltas, and tilt.
The pattern for M4 was [sonorants>obstruents]. However, M2 displayed a distinct trend compared to the other parameters, showing a decreasing order of [stops>nasals>affricates>liquids> fricatives]. M2 does not appear to be influenced by airflow obstruction or the airflow path. Instead, it seems to be affected by the closure in the vocal tract, as both stops and nasals showed higher M2 values.
Previous studies on sonorants suggest that future research should focus on individual Korean sonorants. In this study, the differences in M3 between liquids and nasals were significant, with liquids showing higher values than nasals. This finding contrasts with the results reported by Themistocleous et al. (2022), who found that stressed lateral approximants [l] had significantly lower skewness compared to stressed nasal [n] in Athenian Greek. The discrepancies between these results may stem from the inclusion of two nasal phonemes ([m] and [n]) in the Korean data, as well as phonetic differences between Korean and Greek. In addition, Tabain et al. (2016a) reported that M1 indicated the apical versus laminal contrast (i.e. tongue contact) in lateral consonants across three Central Australian languages. The dental and palatal laminals exhibited higher M1 than the alveolar and retroflex apicals. Further research is needed to investigate whether the Korean flap [ɾ] and lateral [l] can be distinguished based on spectral moments.
When examining the differences across vowel contexts, M1 and M3 exhibited opposite patterns in their values. The vowel contexts with low M3 values were similar to those with high M1 values. This inverse relationship between M1 and M3 was also evident in the correlations between acoustic variables by manner of articulation, where M1 and M3 showed a negative correlation. This indicates that the energy tends to concentrate more in the higher frequency range as the spectral mean frequency increases.
The skewness of fricatives was high when followed by /i/, contrasting with other manners of articulation. This may be because the articulation of fricatives before /i/ moves posterior in the oral cavity, causing the energy to form in a lower frequency range. This result is consistent with Hwang (2004), who used pre-emphasis during analysis, highlighting the importance of standardizing data processing procedures in future research.
Findings from the Pearson correlation analysis indicated positive correlations between M1-M2 and between M3-M4 for stops and sonorants. Across all manners of articulation, M3-tilt showed negative correlations. This suggests that as skewness increases and energy becomes more concentrated in the low-frequency band, the tail extends to the right, which likely causes the slope to descend. Also, positive correlations between M1-slope_ltas were observed. Thus, when slope_ltas has a positive value (+), the energy in the high-frequency band is greater than in the low-frequency band, which means the energy difference between the two frequency bands tends to increase as M1 increases. Conversely, when slope_ltas is negative (–), the energy difference between the two frequency bands increases as M1 decreases, leading to a sharp decline in the slope.
The most influential parameters for distinguishing between sonorants and obstruents were M3 and tilt. Skewness, which reflects the overall slant of the energy distribution (Jongman et al., 2000), was negatively correlated with tilt in the correlation analysis. This suggests that the overall slope of the energy distribution serves as a key distinguishing factor between obstruents and sonorants.
Finally, the overall classification accuracy in distinguishing obstruents and sonorants was found to be 67.67%, which is relatively modest. While sonorants are not typically analyzed using moments, this study employed these parameters to examine both obstruents and sonorants. This approach may have contributed to the relatively lower classification accuracy. Nevertheless, some acoustic parameters discussed earlier indicated somewhat clear distinctions between the two consonant categories. For example, significant differences were found in M4, following the pattern of [sonorants> obstruents]. Future research could extend moments analysis toward sonorants by focusing on these cases.
Through this study, the analysis of spectral moments in Korean consonants has revealed that these parameters exhibit unique patterns and are useful for describing Korean consonants in general. These findings could serve as a reference database for Korean consonant productions. However, as this study was based on a dialogue corpus, future research should investigate the acoustic differences between conversational speech and carefully articulated or reading-style speech.


